Bear 71
Take a walk on the wild side
Explore the intersection of humans, nature and technology through the eyes of a mother Grizzly bear, from the moment she is tagged to the moment of her untimely death. Bear 71 is a story that blurs the lines between the wild world and the wired one.

Type
Website, installation
View it
bear71.nfb.ca (original flash website),
or bear71vr.nfb.ca (2017 VR version, on which I did not work)
Agency
NFB Interactive
Awards
2012: Site of the Year, FWA // Gold Cyber Lion, Cannes Lion // Technical Excellence, FITC // NetArt, Webby Awards // Nominated for 3 more Webby Awards // Best Non-Fiction Web Series, Digi Awards // Gold Pencil, The One Show // Not for Profit/Public Service, ADCC // Best Website, Communication Arts / 2013: Entertainment, Arts and Tourism, Applied Arts Awards // Online Video, Applied Arts Awards // 2013: Best Non-Fiction Web Series, Banff World Media Festival // Nominee, Best use of Interactive Video, Webby Awards
Role
Design of “The Grid” (topography, iconography, colours, positioning, characters) + many (but not all) interface screens; concept + design exploration, 3D animation samples
Press Wired // Fast Company // PBS // TheNextWeb // Huffpost // International Documentary Association // AdAge
Collaborators
Leanne Allison (creator) + Jeremy Mendes (creator, art director) // Loc Dao, Dana Dansereau, Vanessa Fukuyama, Jennifer Mete, Janine Steele (NFB production) // Pablo Vio + Media Ridha at Jam3 (development, some design) // J.B. MacKinnon + Jennifer Moss (writing) // Patrick Johnson (wordmark design) // Bill Hardman + Hart Snider (video editing) // Joshua Stevenson (sound design)
They also gave me a number
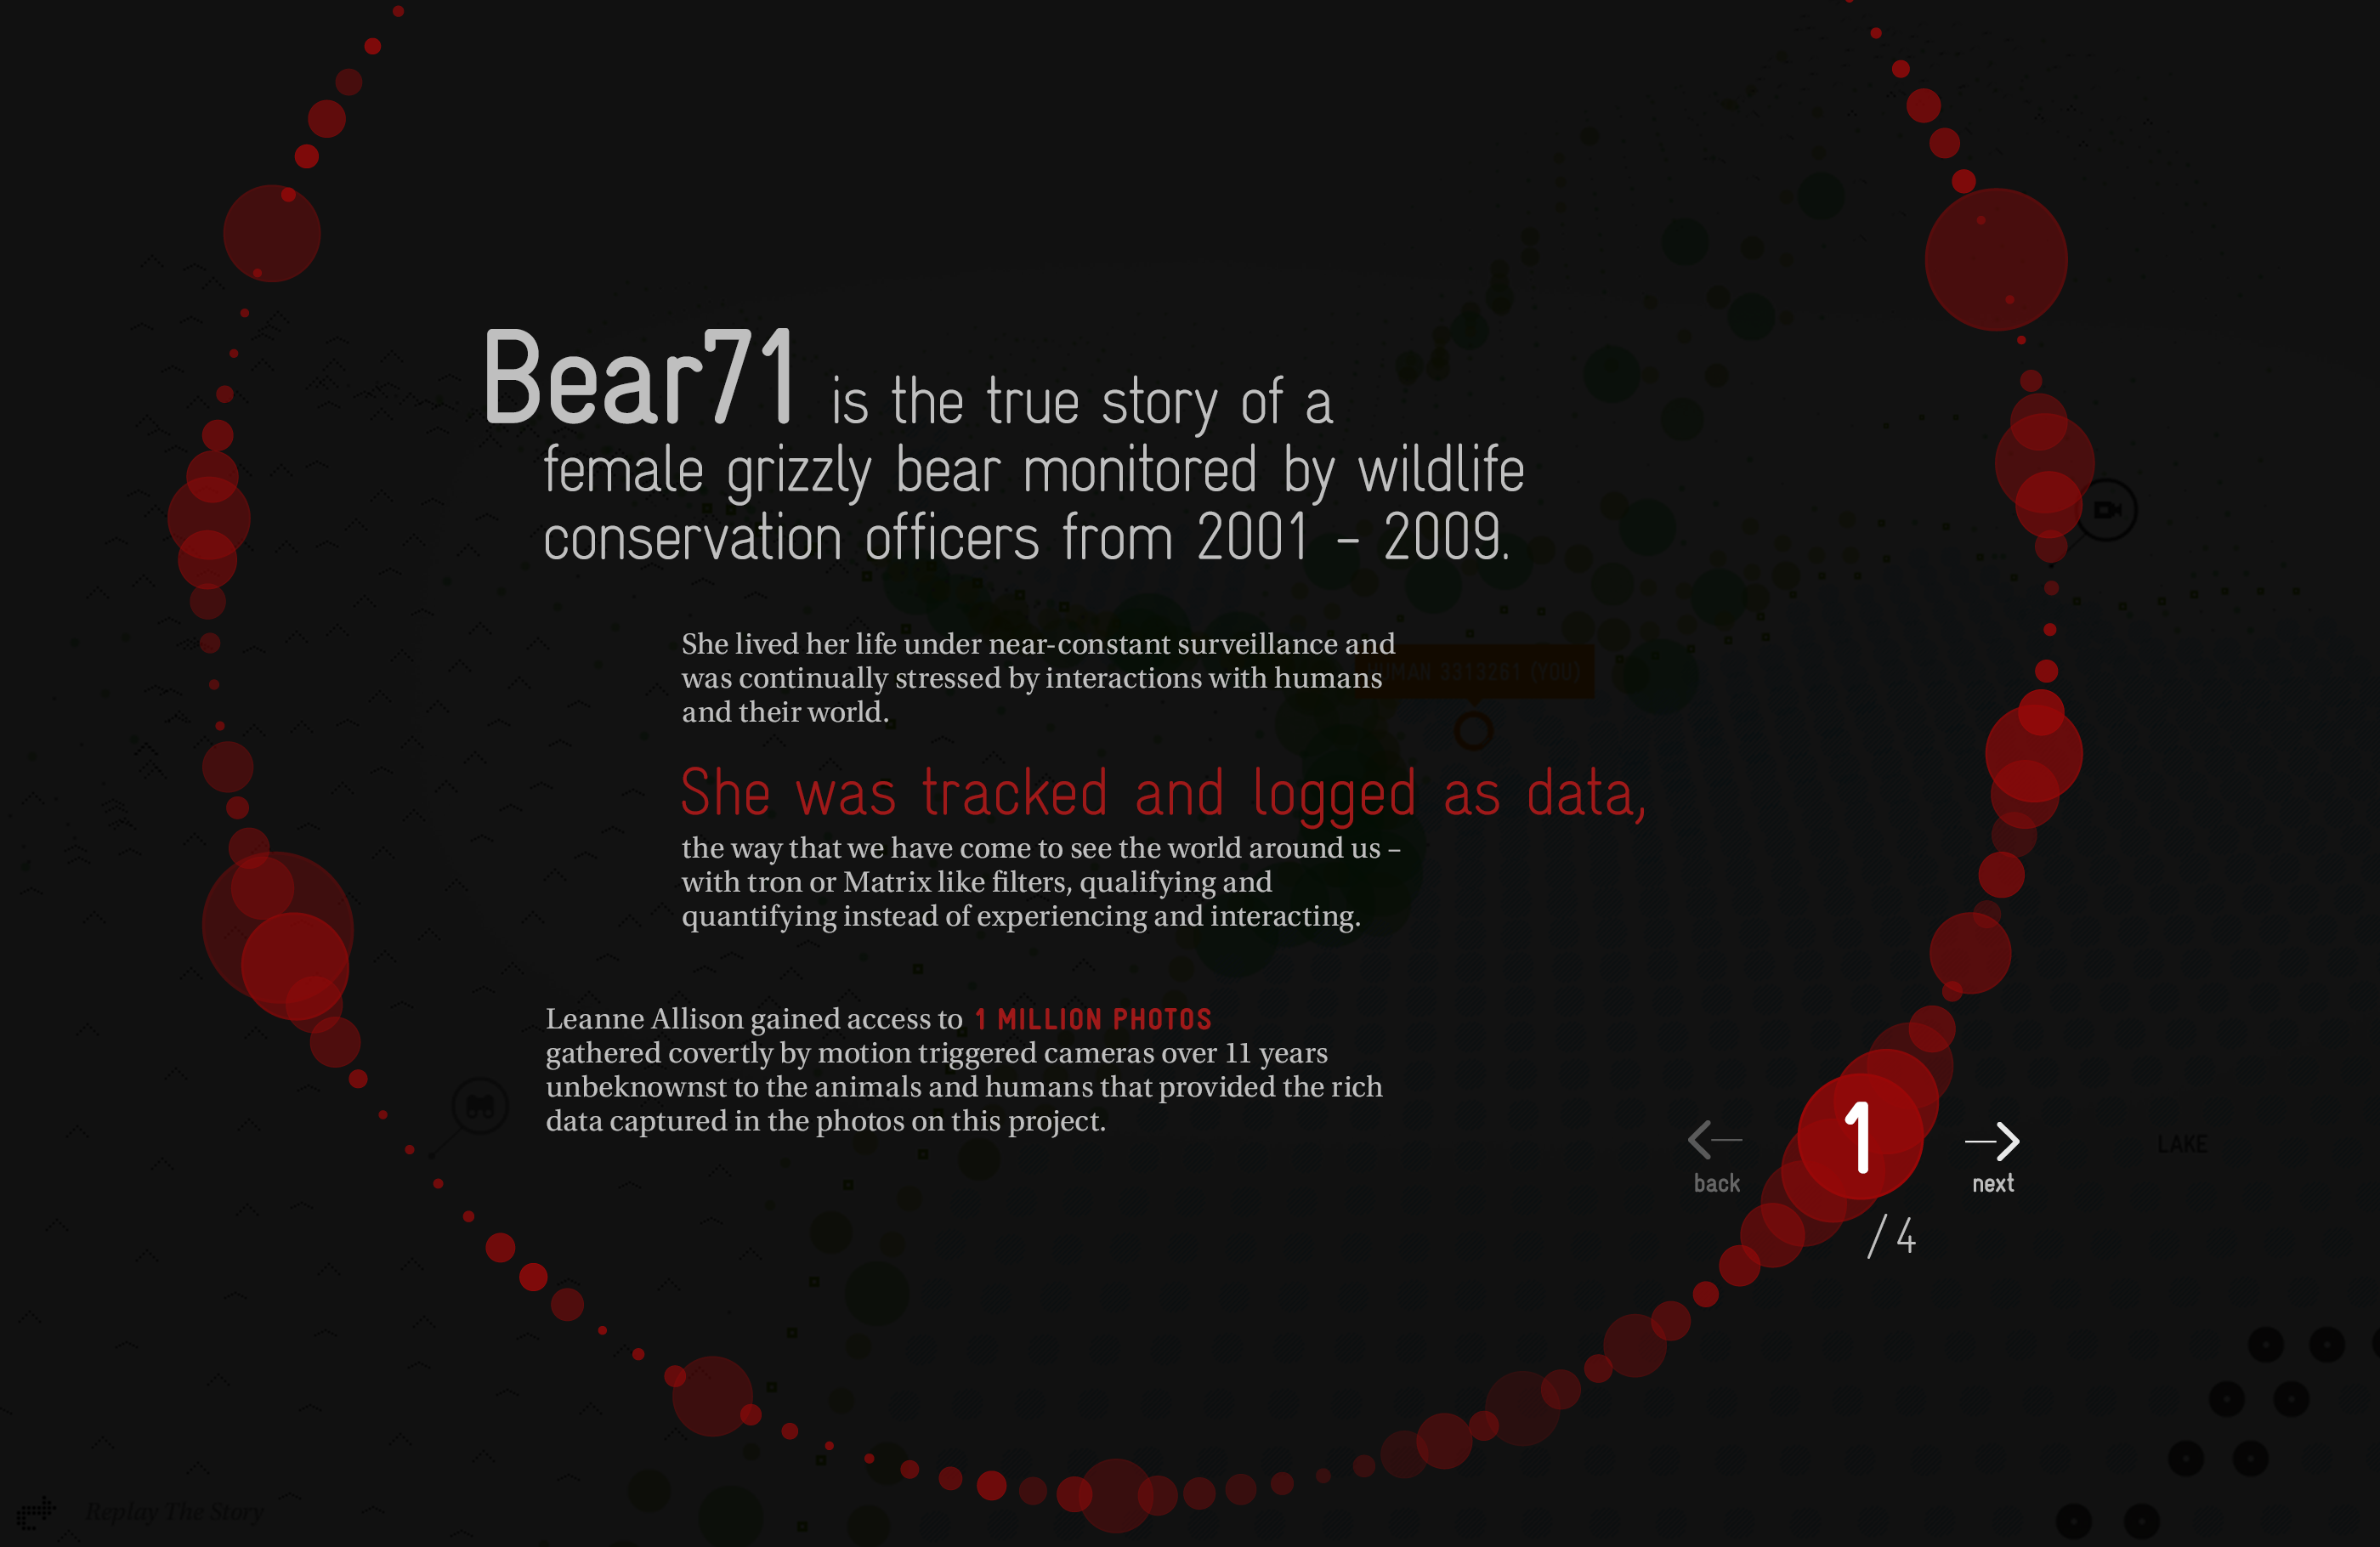
About the project
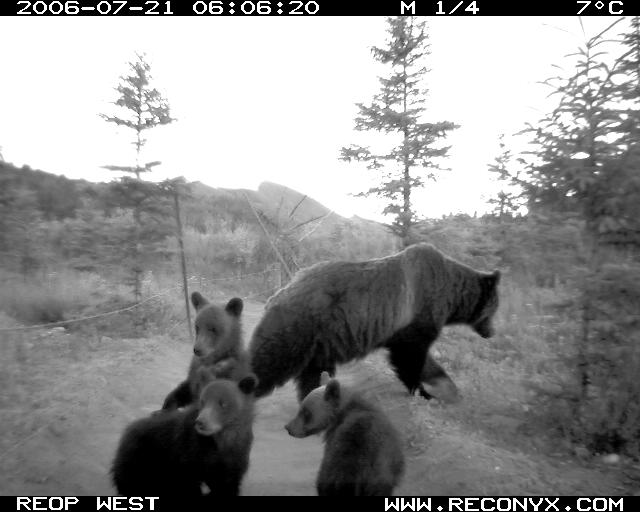
Bear 71 is the true story of a female grizzly tagged and tracked by surveillance cameras in Banff National Park, and serves as a parable for a tech-obsessed culture.
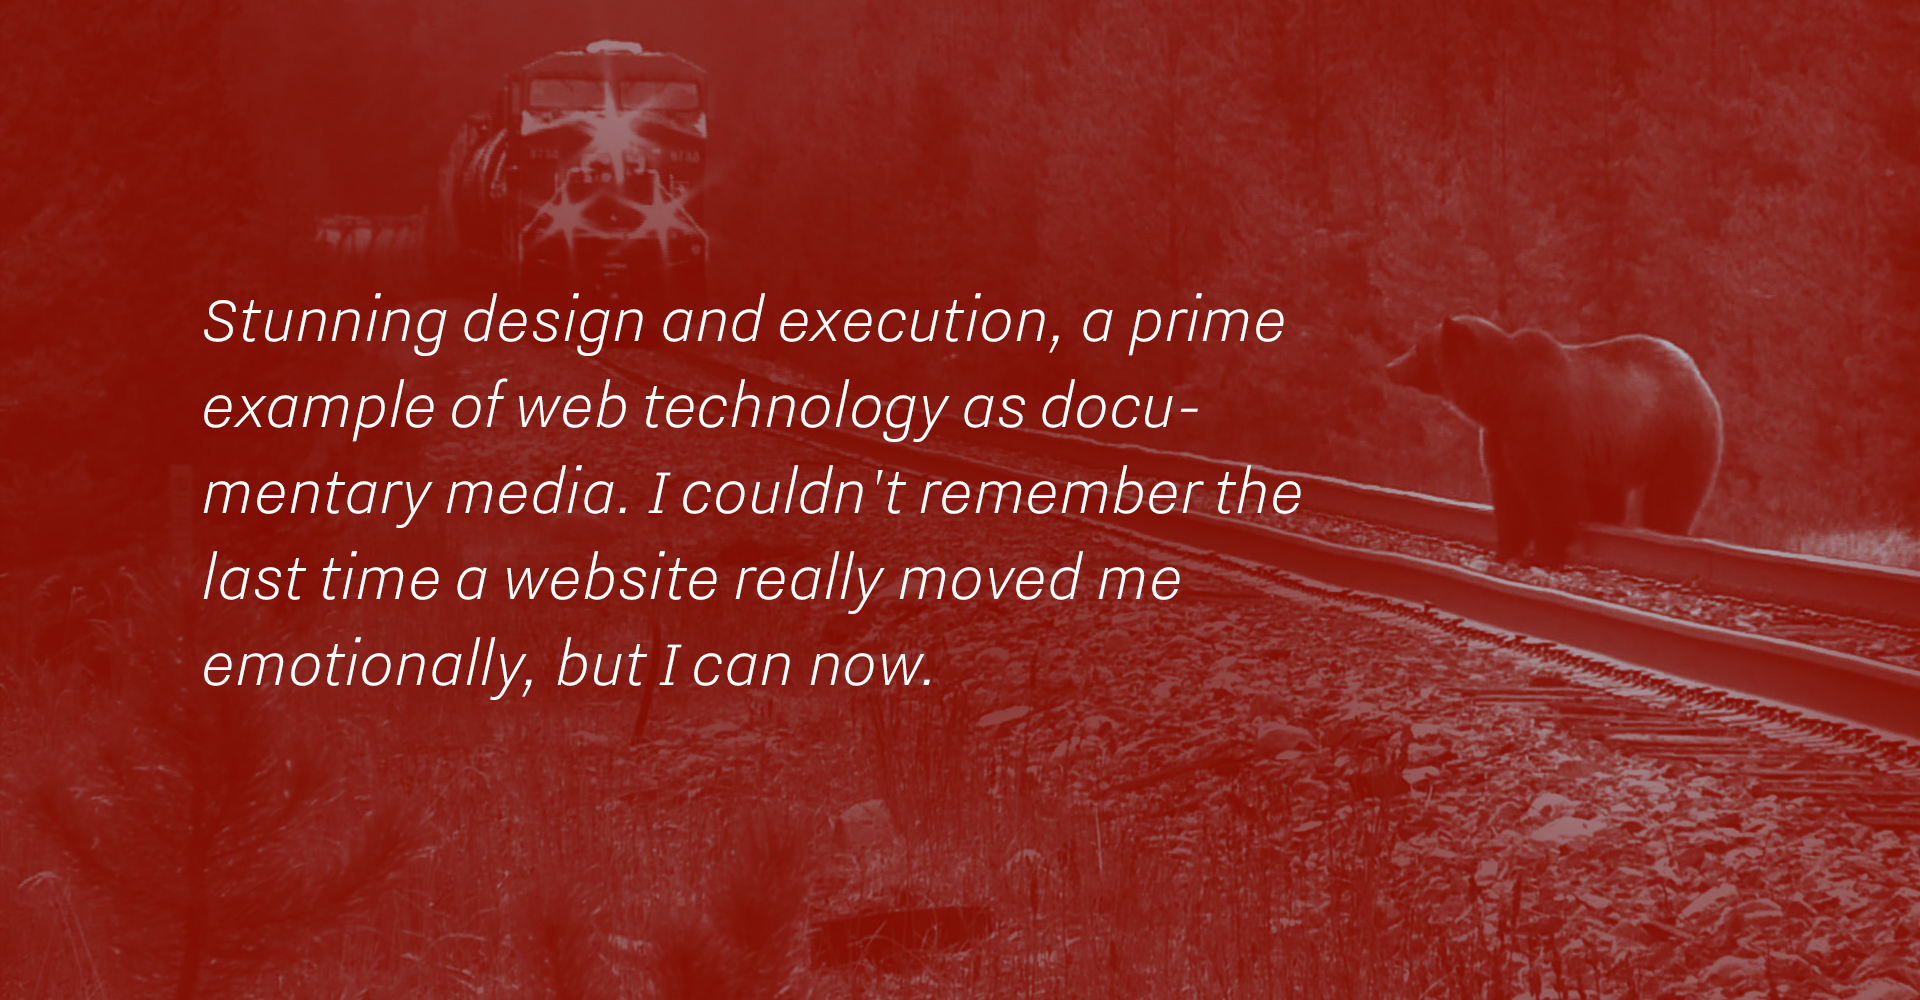
Ville Heijari, Rovio, judge for the 2012 FWA Site of the Year
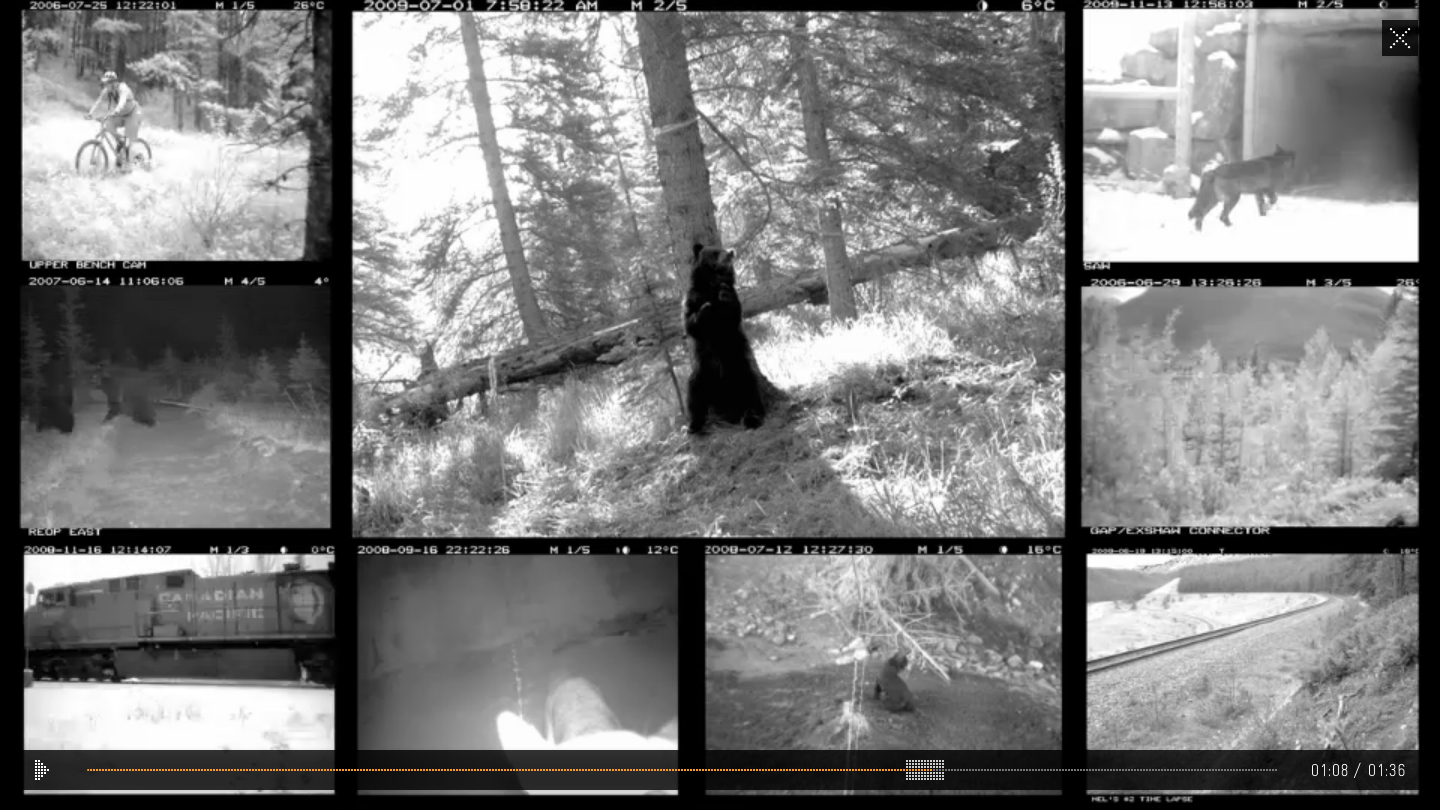
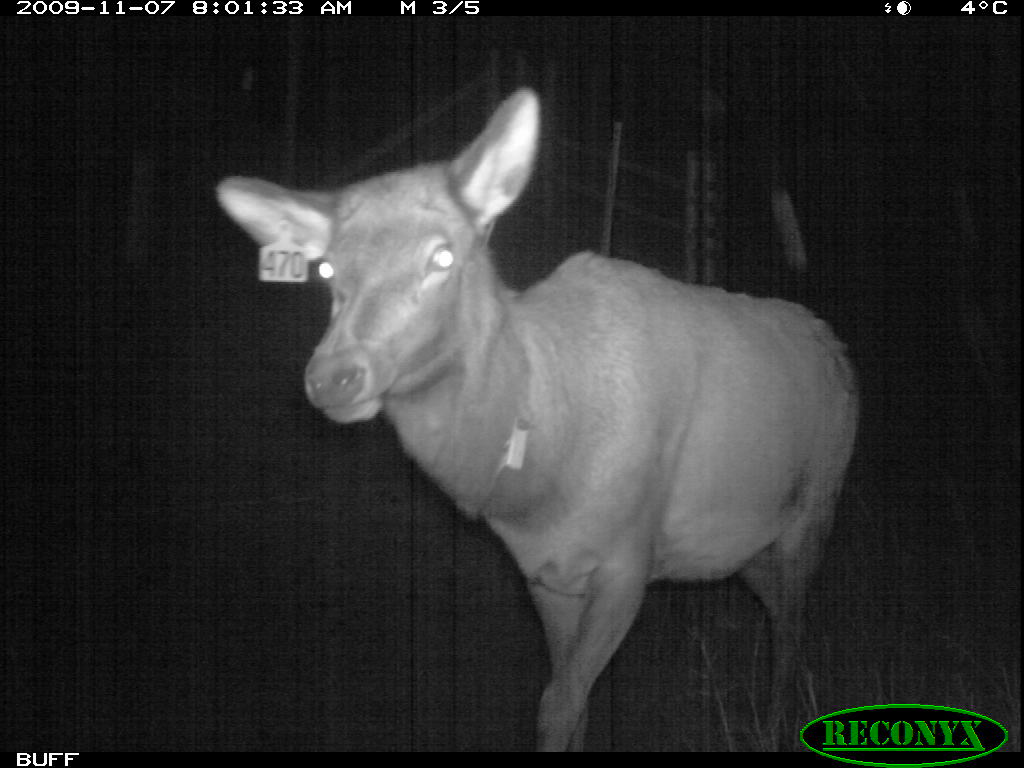
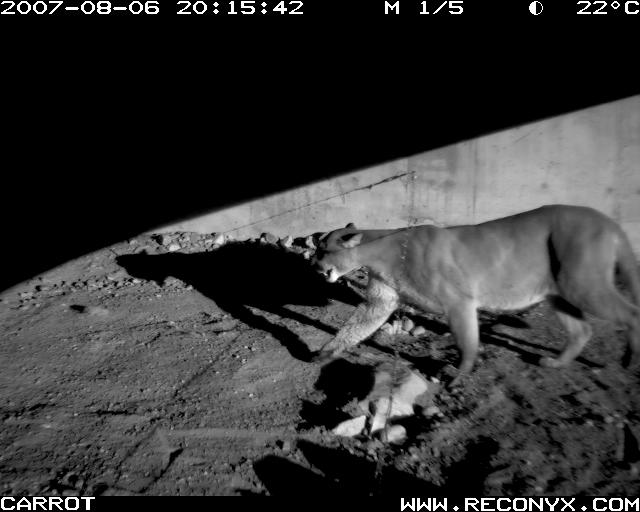
The tale itself is captivating, but as a linear story told inside a non-linear visual experience, it is the delivery that sets the website apart. There’s a “choose your own adventure” 3D topography-as-data-visualization; millions of grainy trail cam photographs; the solemn and omniscient voice of Bear 71 herself leading you from chapter to chapter; video clips that sporadically take over your screen; and all the while your webcam may be monitoring you just like one of your fellow park creatures, not to mention the other users you will encounter in the storyscape.
The voice of the bear is performed by Mia Kirshner (The L Word, 24) and written by J.B. MacKinnon (The 100-Mile Diet), and the experience features music by Radiohead, Sigur Rós, Atlas Sound and Grouper.
It’s a what?
A snapshot of the experience
The project is best explained by exploring the site itself, but these two videos are the next best thing.
Bear 71 trailer by the NFB, 2012
Project description video by Jam3, 2012
Writing her story on the trees
Impact
Bear 71 was a pioneer project that defined the term “interactive documentary” and drew tremendous press and accolades. By the time it was rebuilt for a new generation and new technology, the original site had attracted nearly 370,000 unique visitors.
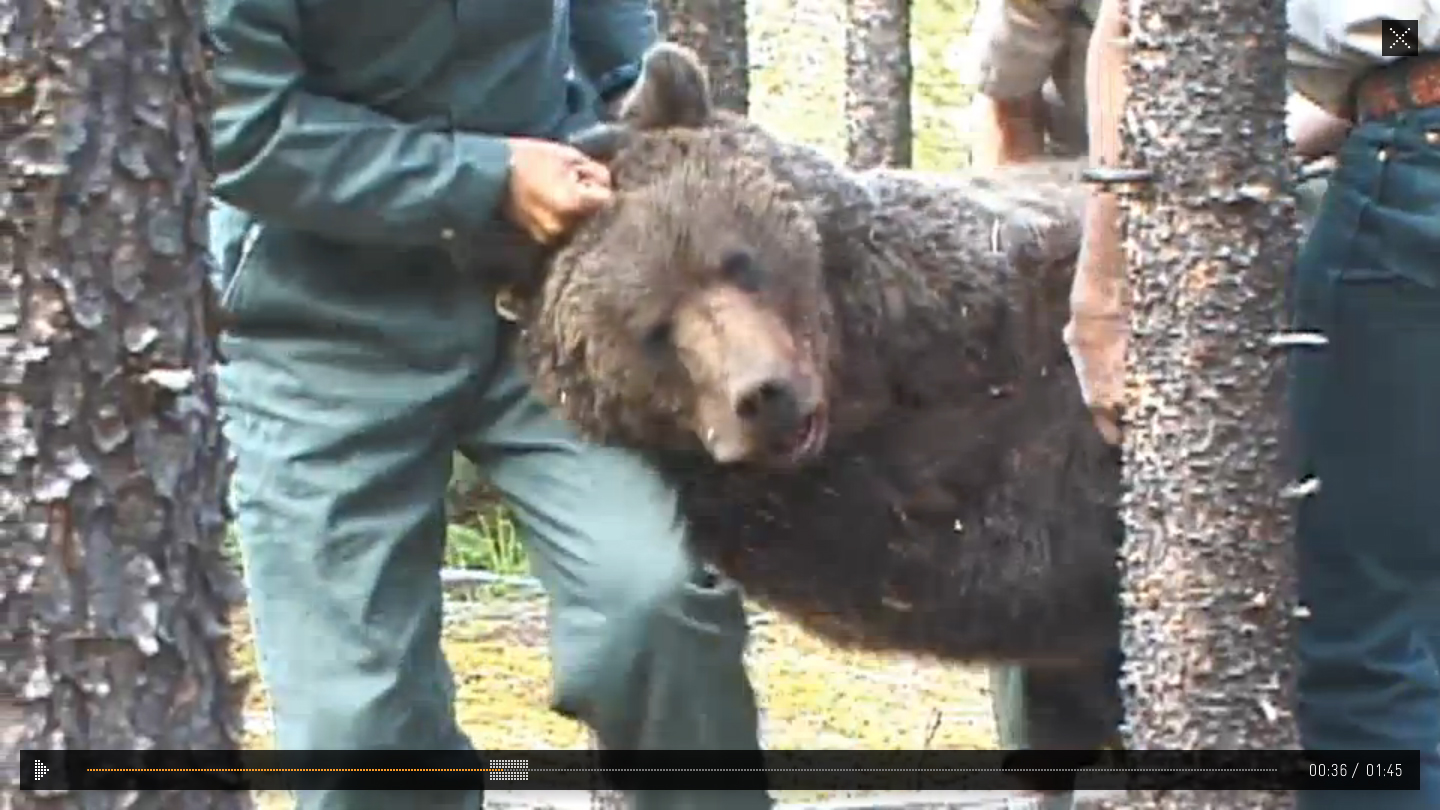
In the wake of the project, Parks Canada and CP Rail started making changes to help protect wildlife partly due to awareness raised by Bear 71, while schools across Canada adopted the use of Bear 71 in their classrooms for educational purposes.
The forest has its own language
My role + challenges
I worked on the project in two phases. First, the NFB asked me to conduct a design exploration of ideas and screens for the UI, after which Jam3 would develop some prototypes. Second, I completed designs once the team had cracked some UX conundrums.
From the outset, it was obvious that on its own the script was a touching linear first-person story.
The voice of Bear 71
However, the creators Jeremy Mendes and Leanne Allison envisioned an interactive documentary, and the challenges were:
However, the creators Jeremy Mendes and Leanne Allison envisioned an interactive documentary, and the challenges were:
- How would Bear 71’s narration exist in a non-linear user experience?
-
When would the audience have control of the visuals, and when might the story take over?
-
How would they interact with the park’s data caches, camera footage, animals and other users?
- Most specifically to me, how to design an interface that both felt like the code of the Matrix and a natural national park-like landscape? How to depict Bear 71’s plight, navigating the maze of highways, trains, trails and town developments, all the while being tracked by Big Brother?
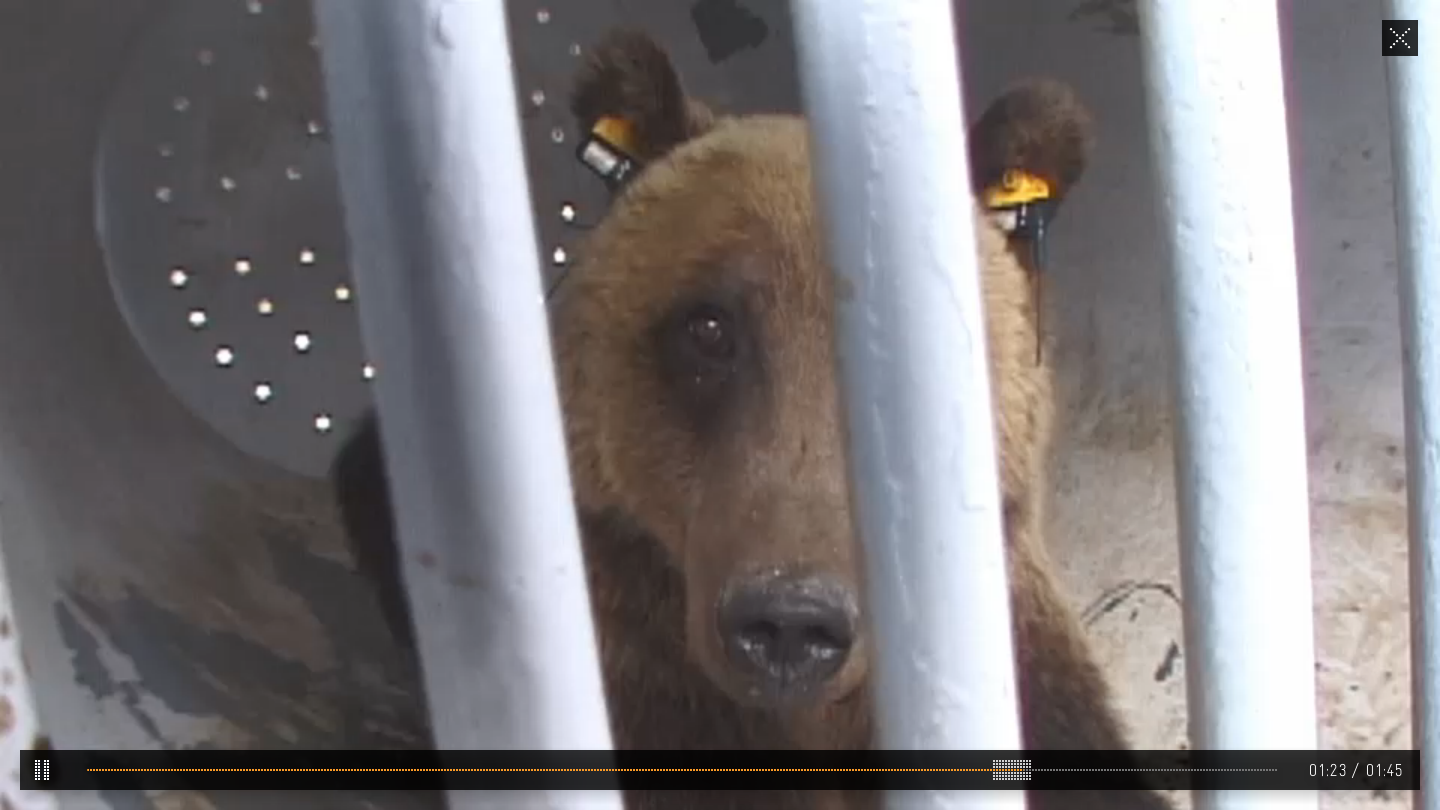
Tagged and collared
The Grid — final designs
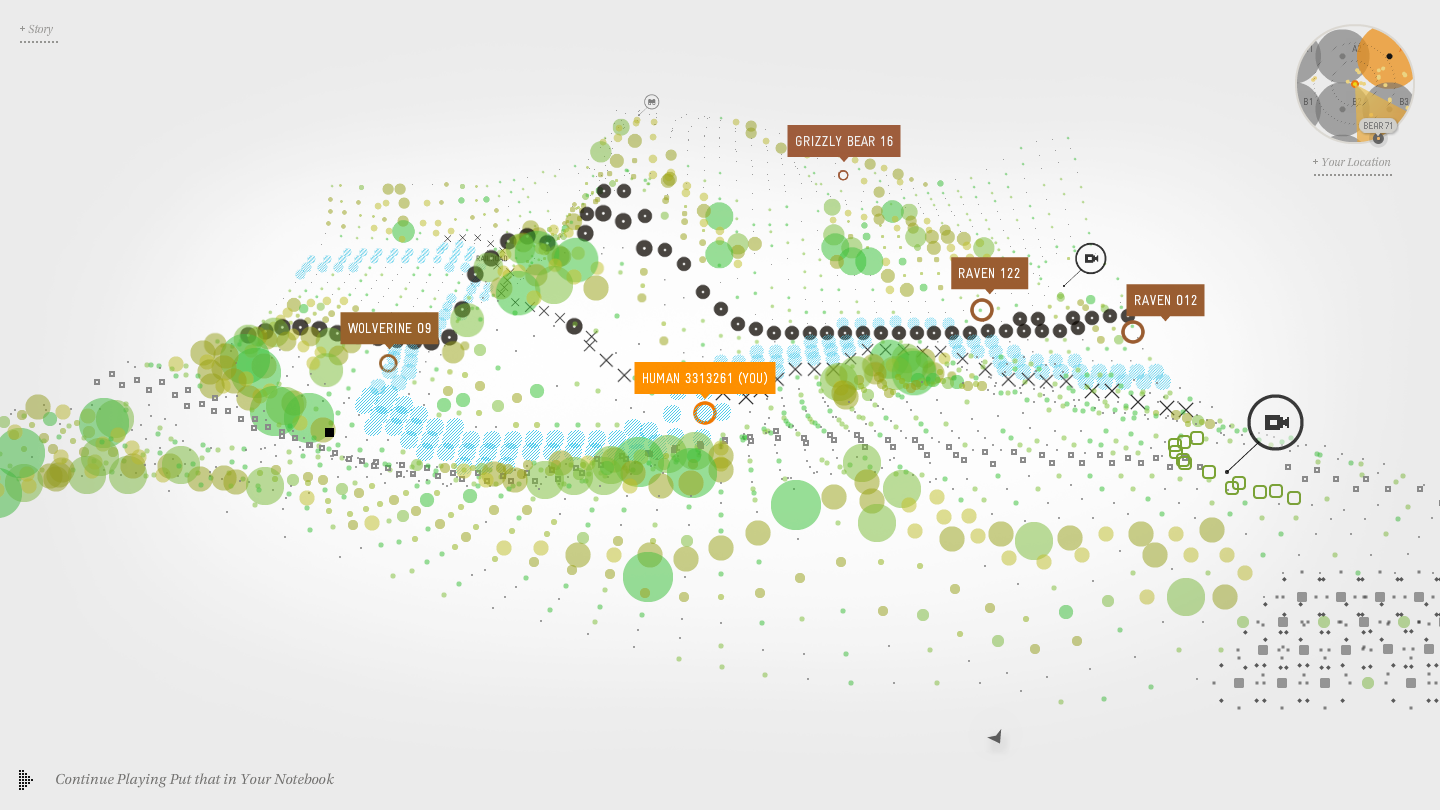
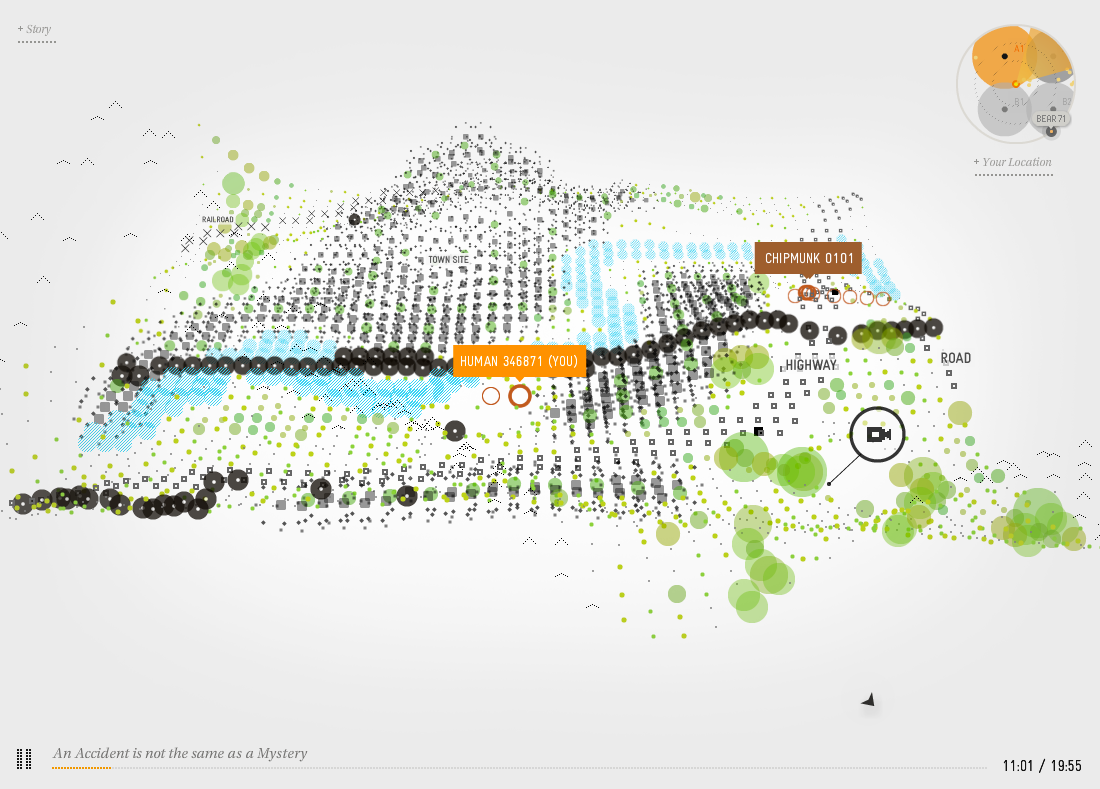
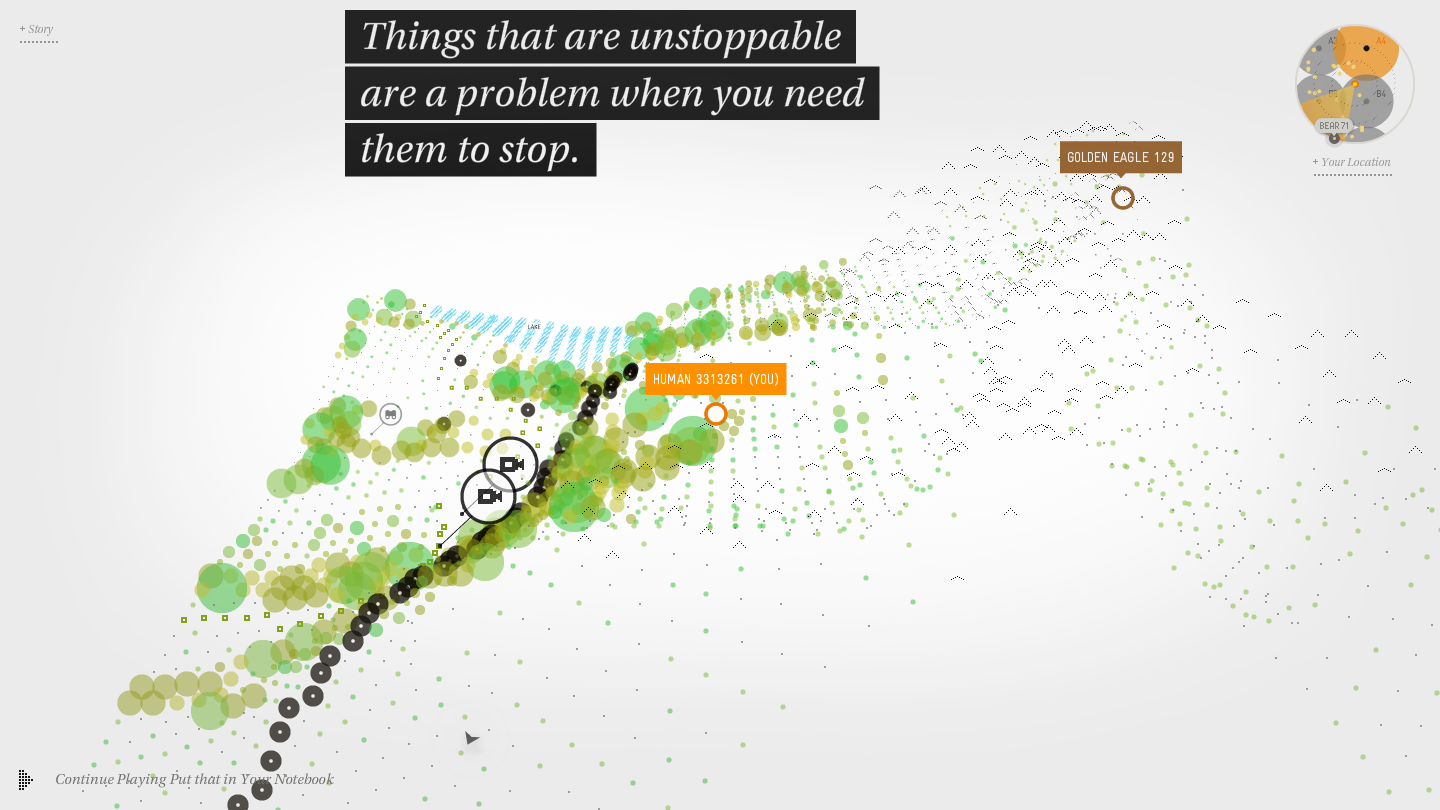
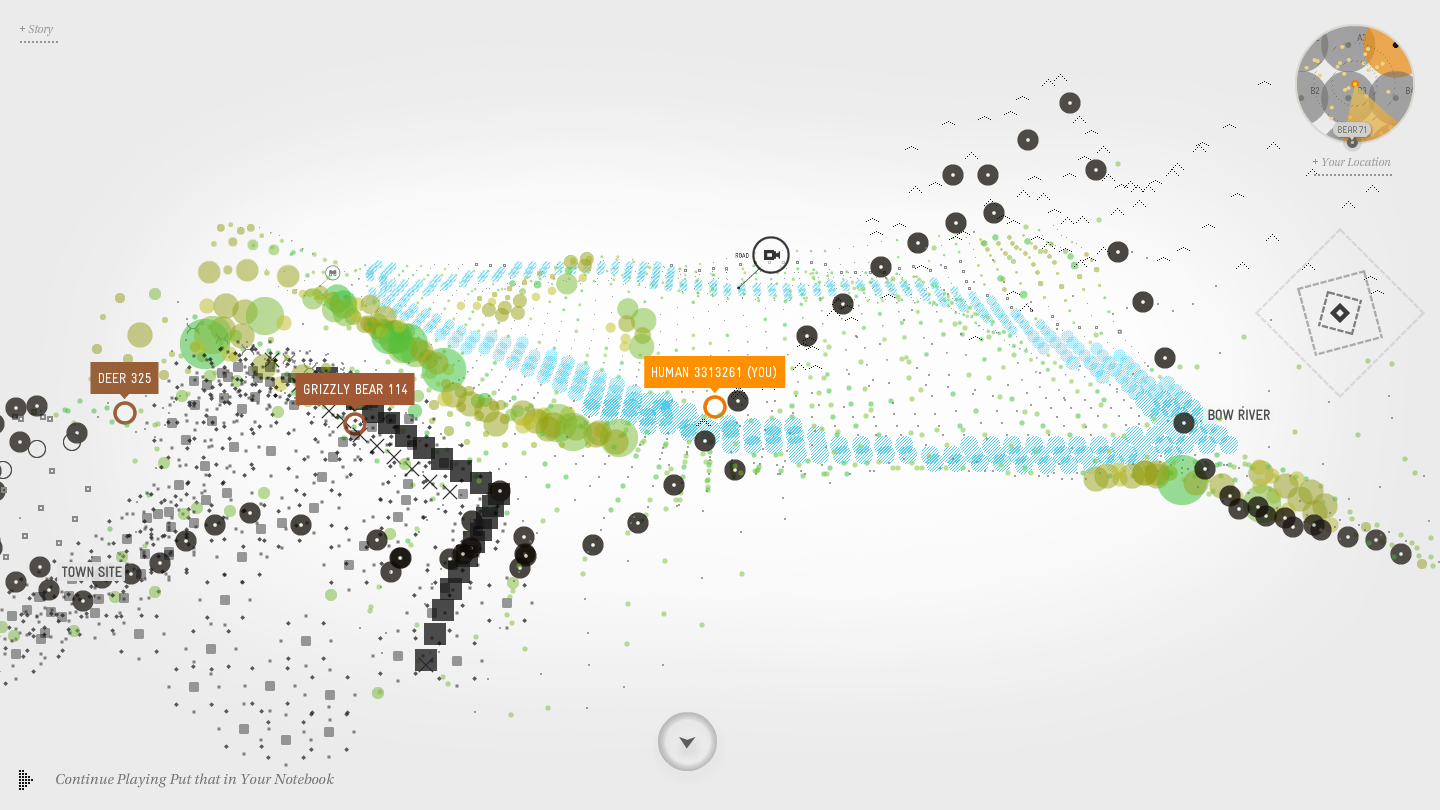
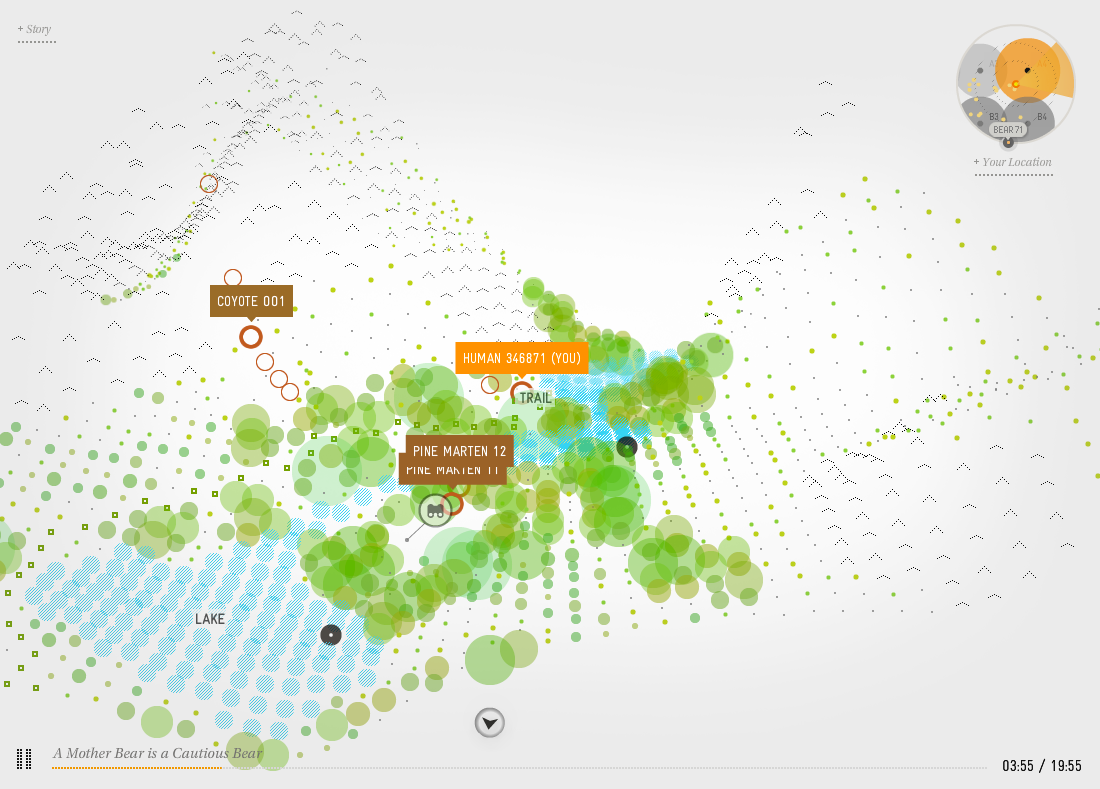
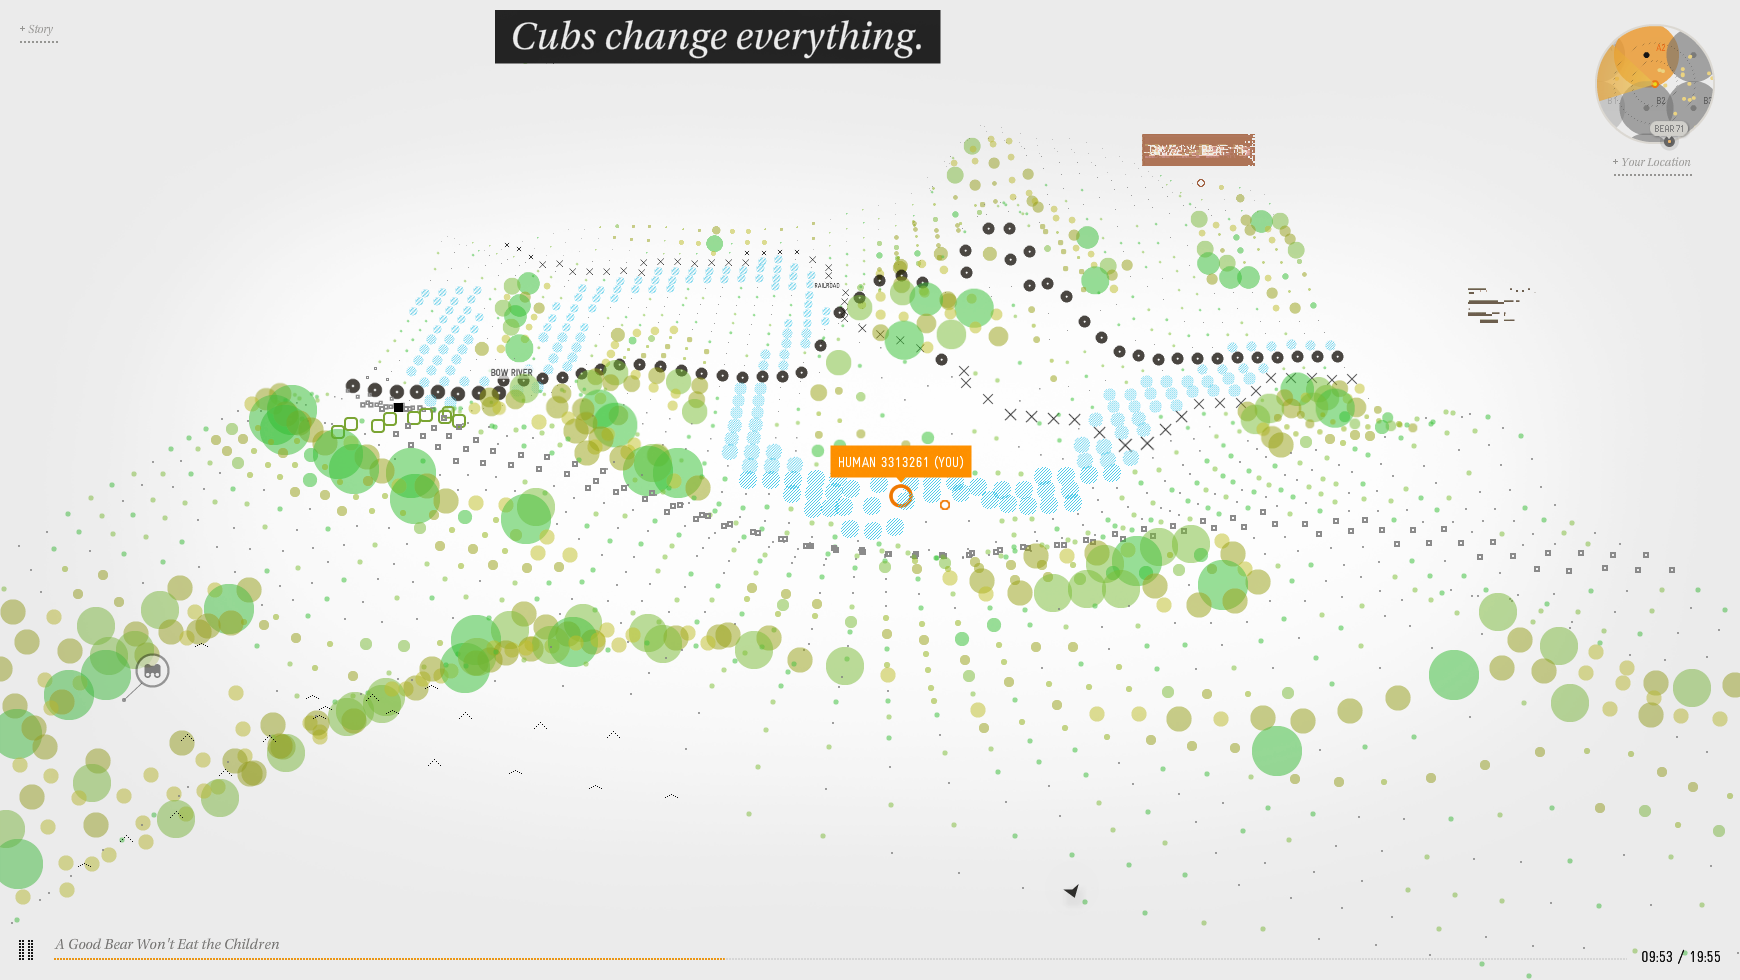
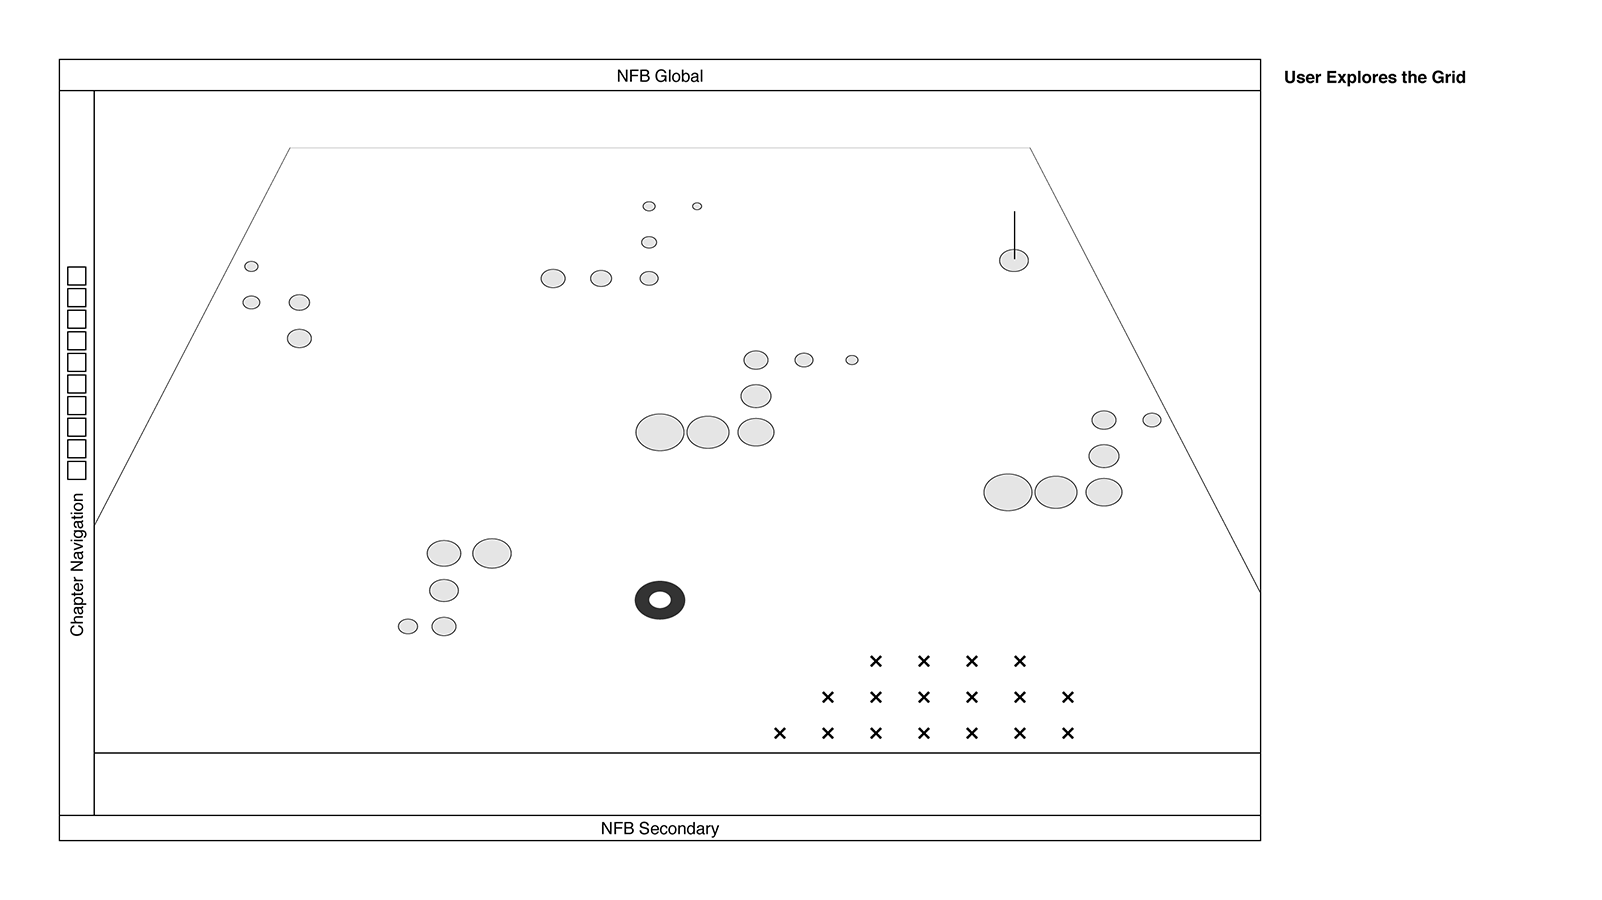
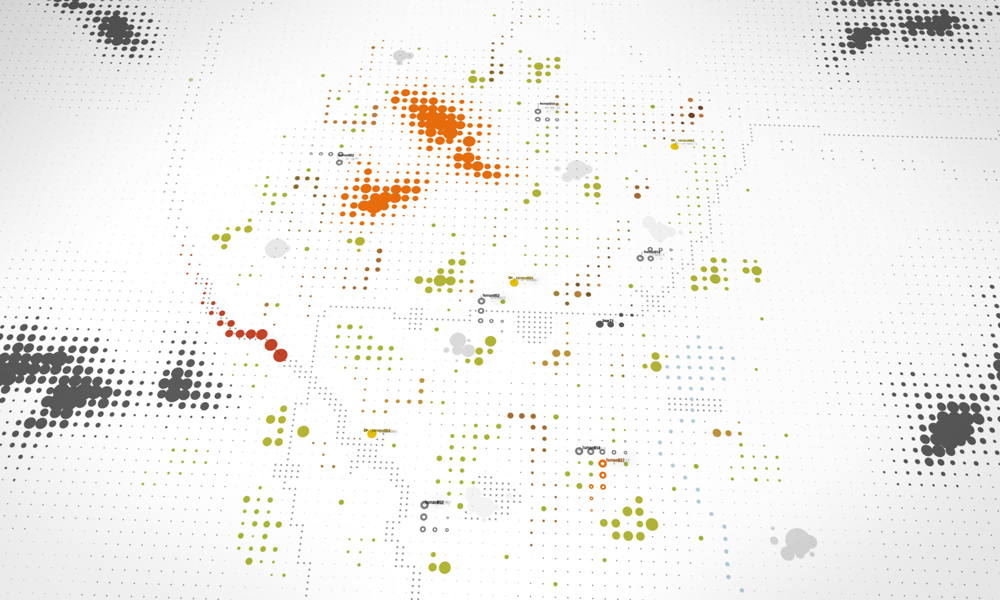
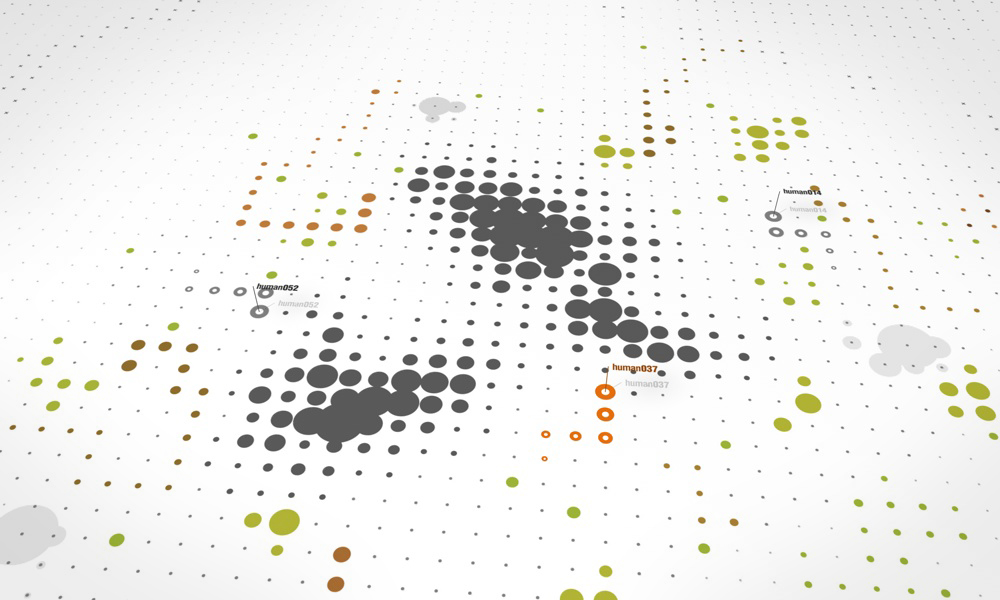
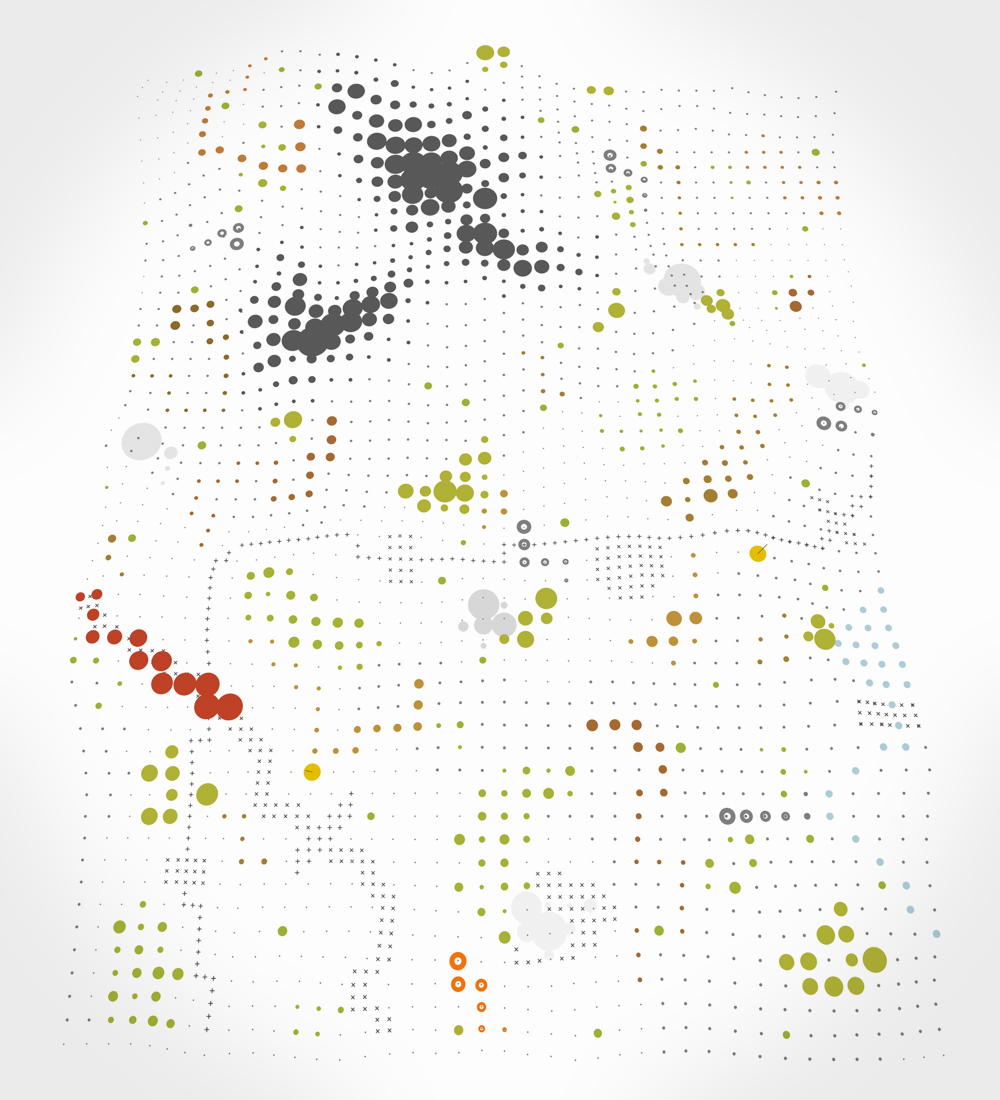
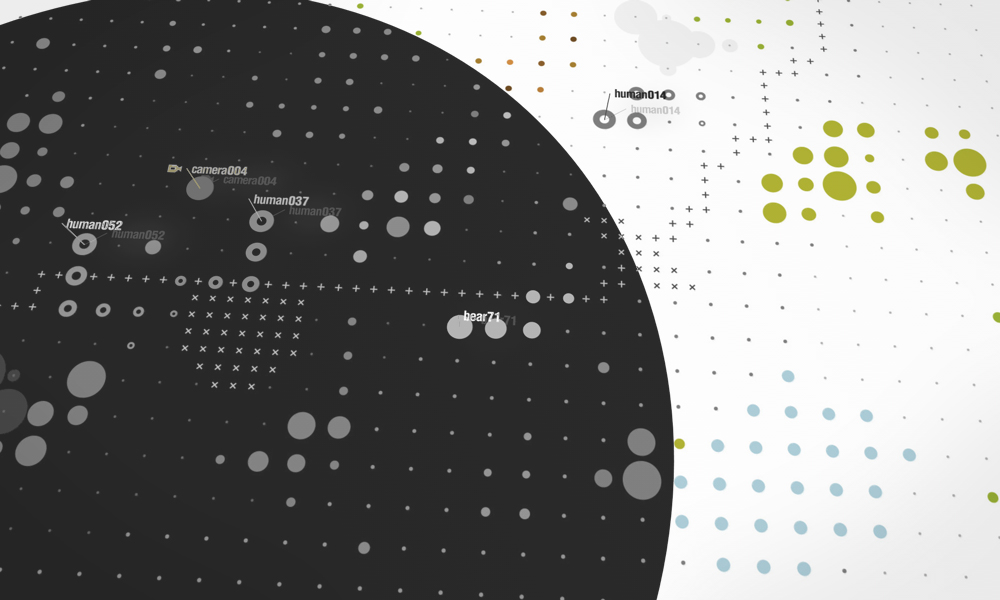
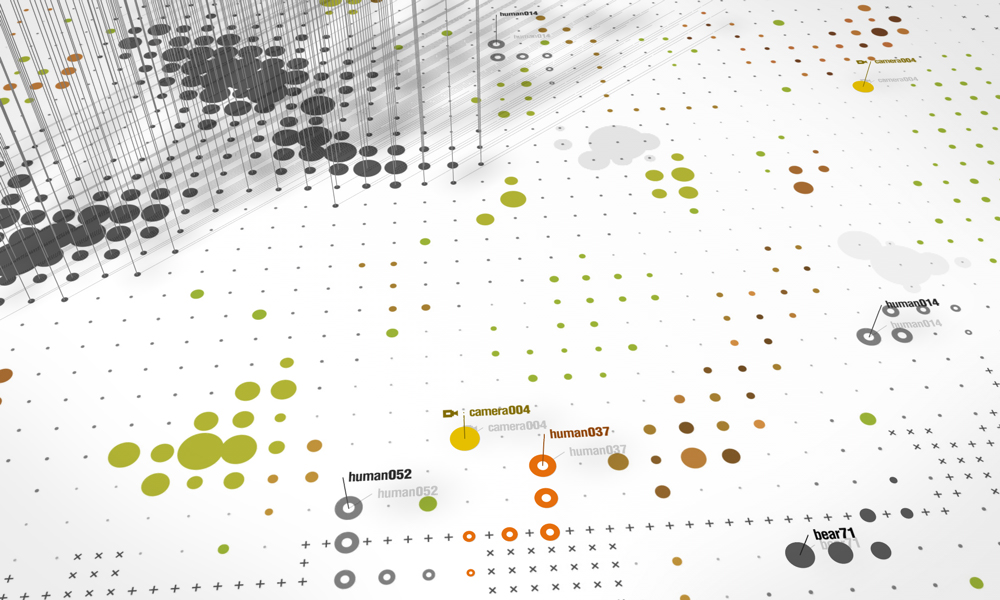
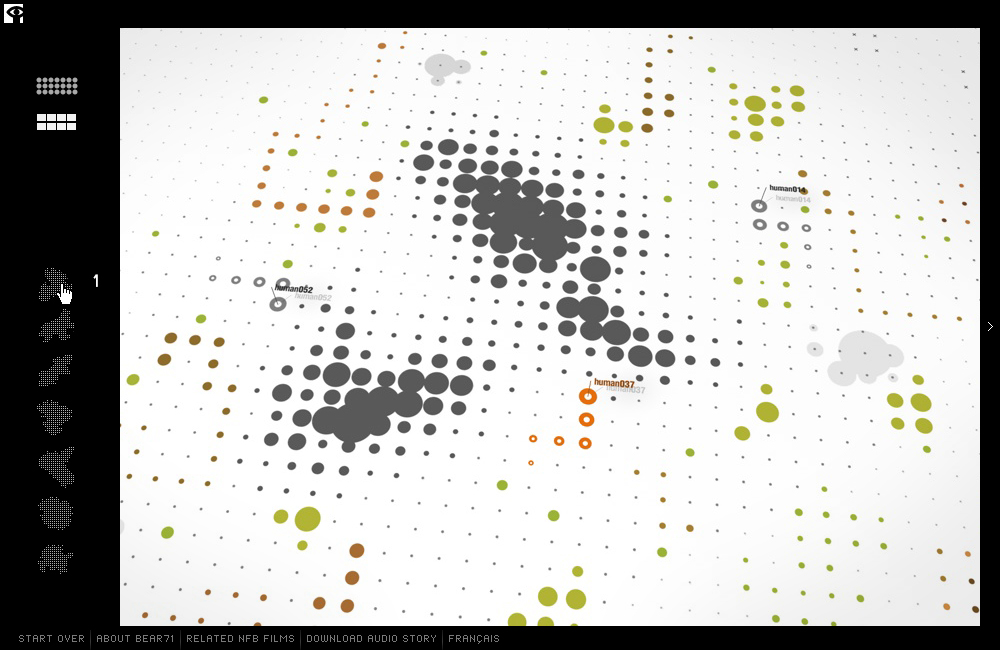
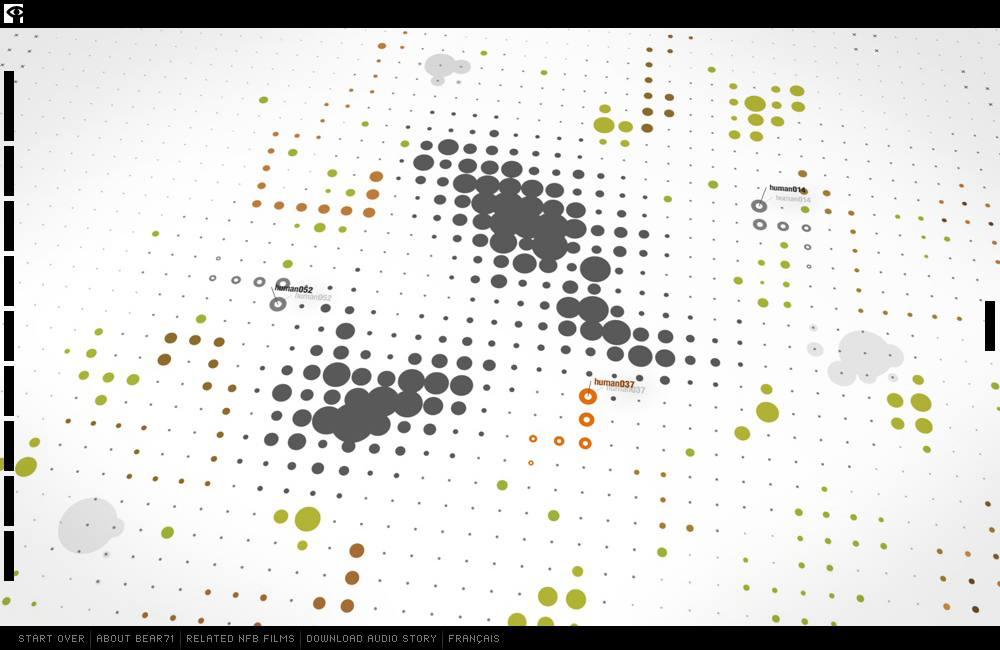
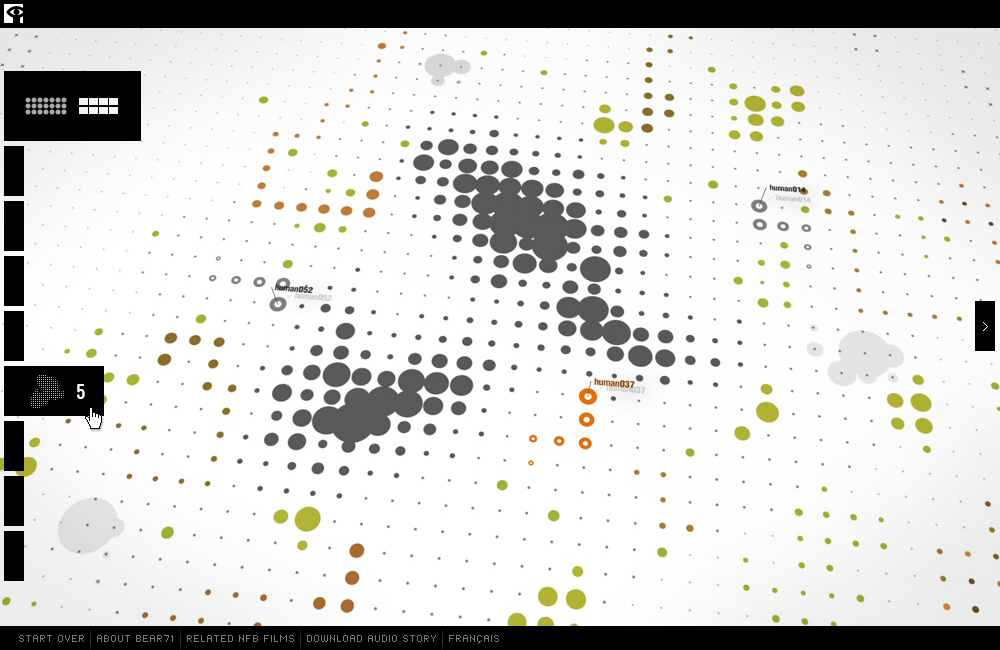
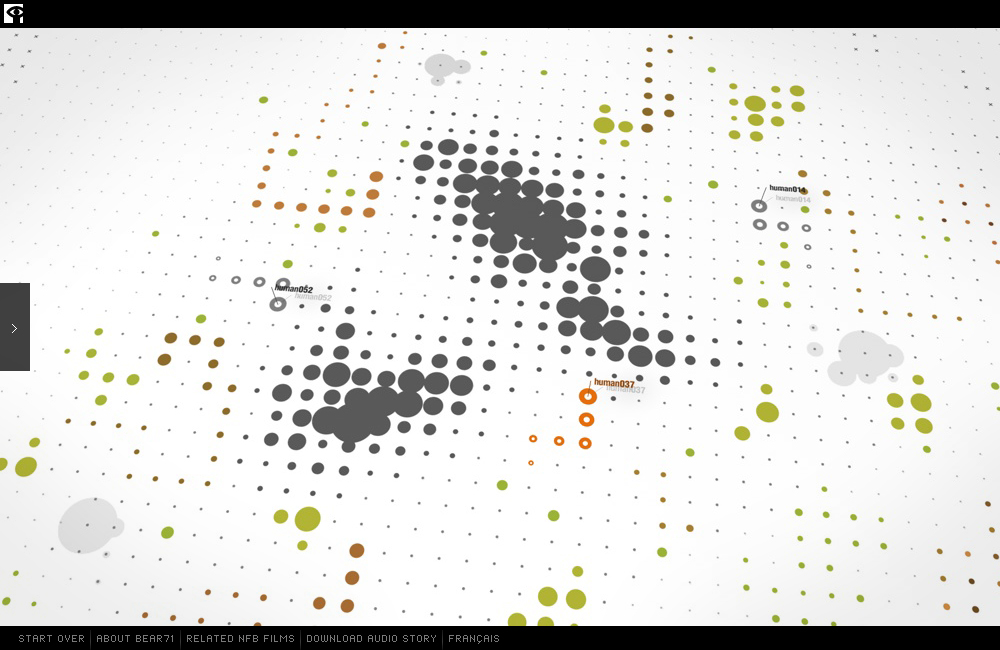
Most of the action takes place in “The Grid”, an abstract map of the park, comprised of thousands of stylized data points. The 3D landscape represents technology’s view of nature, and suggests the extent to which we have mapped, tracked and measured life in the park.
Video — browser screencast of Grid exploration
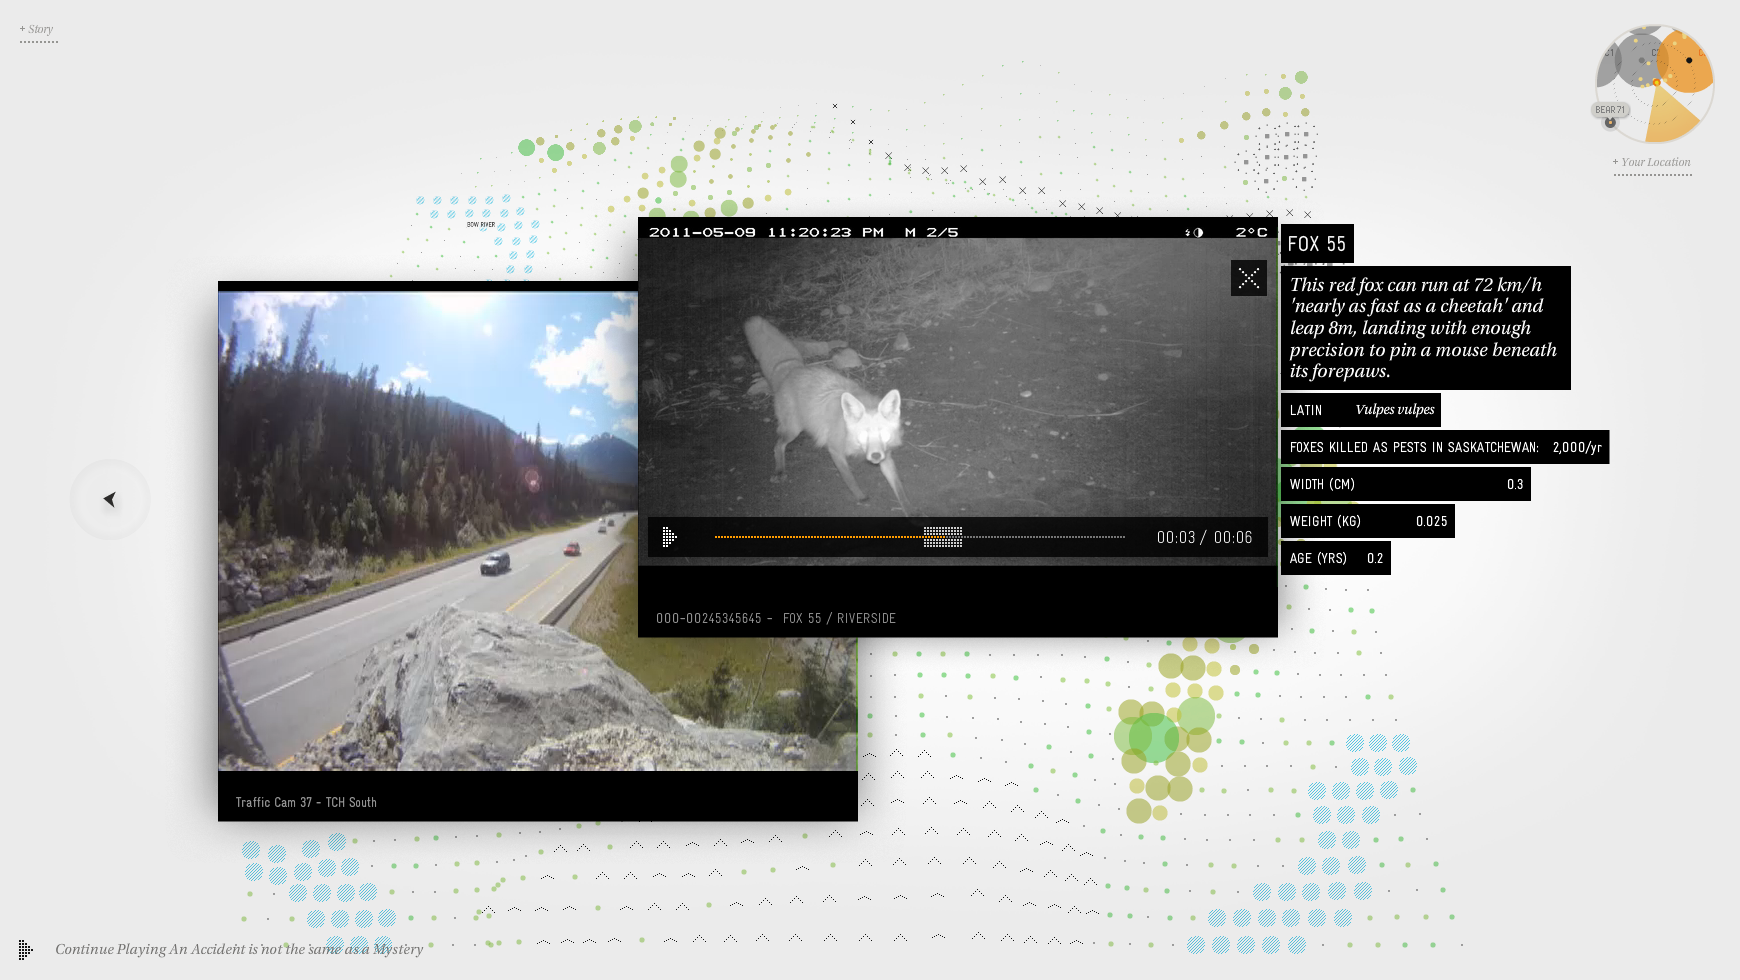
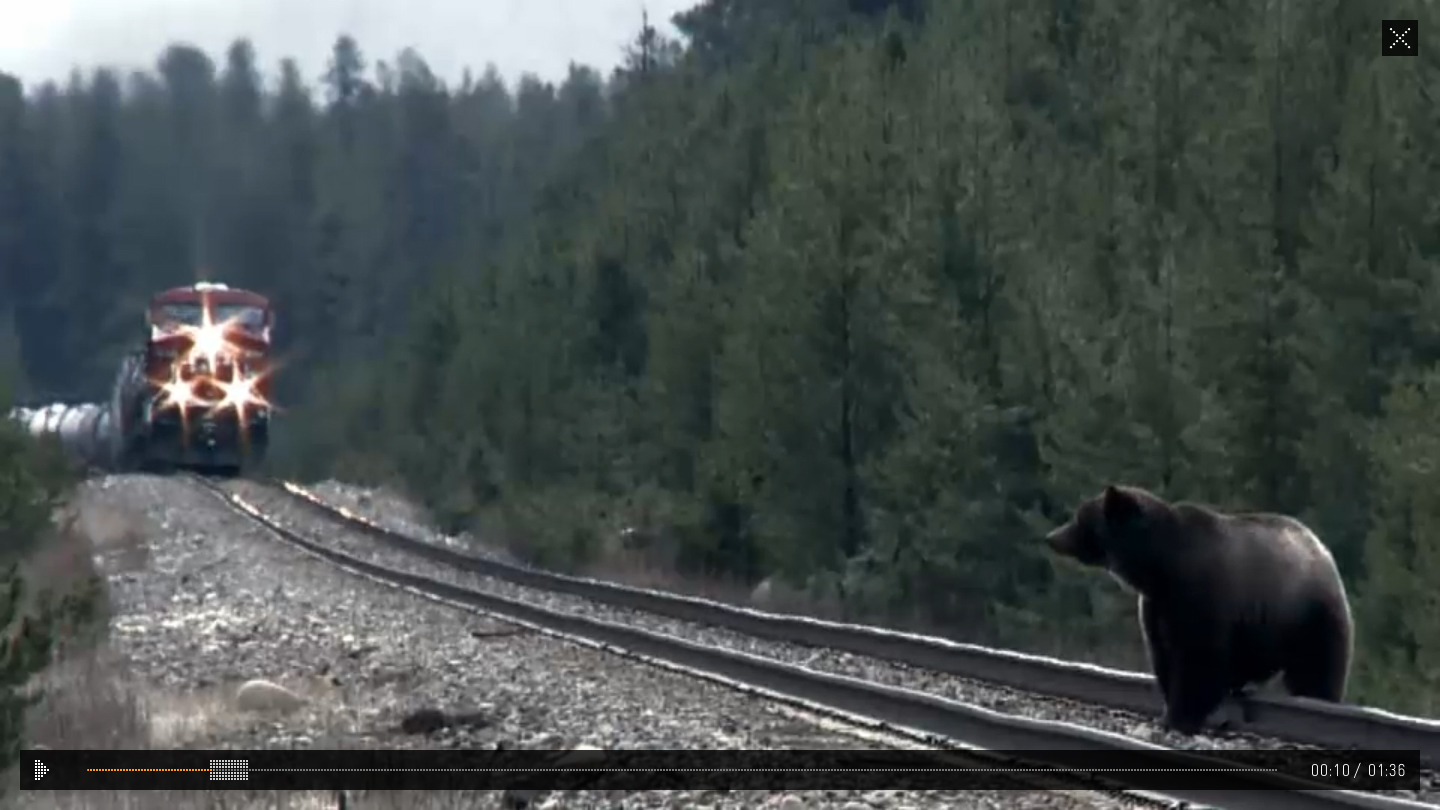
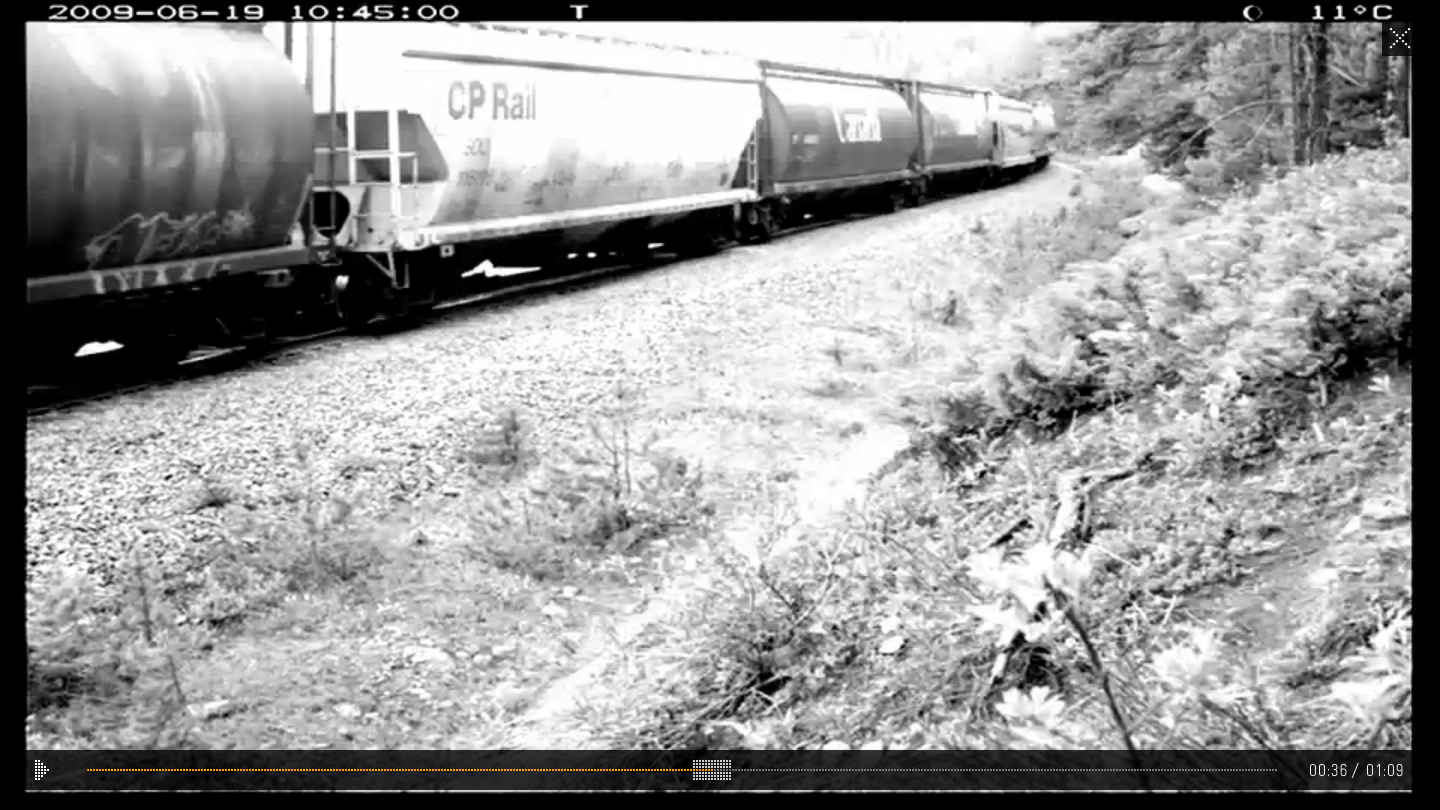
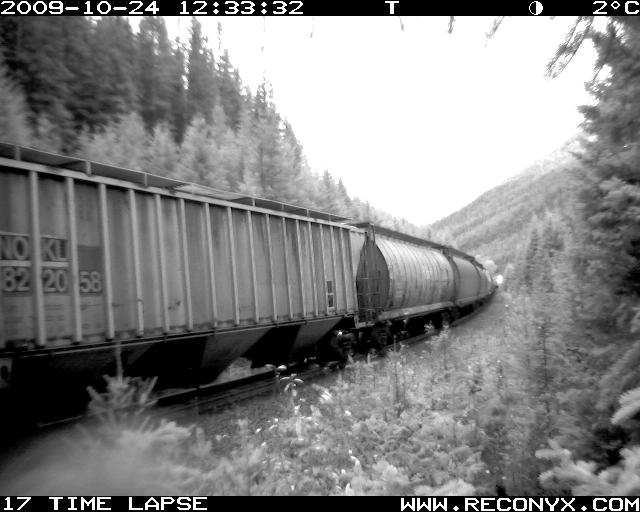
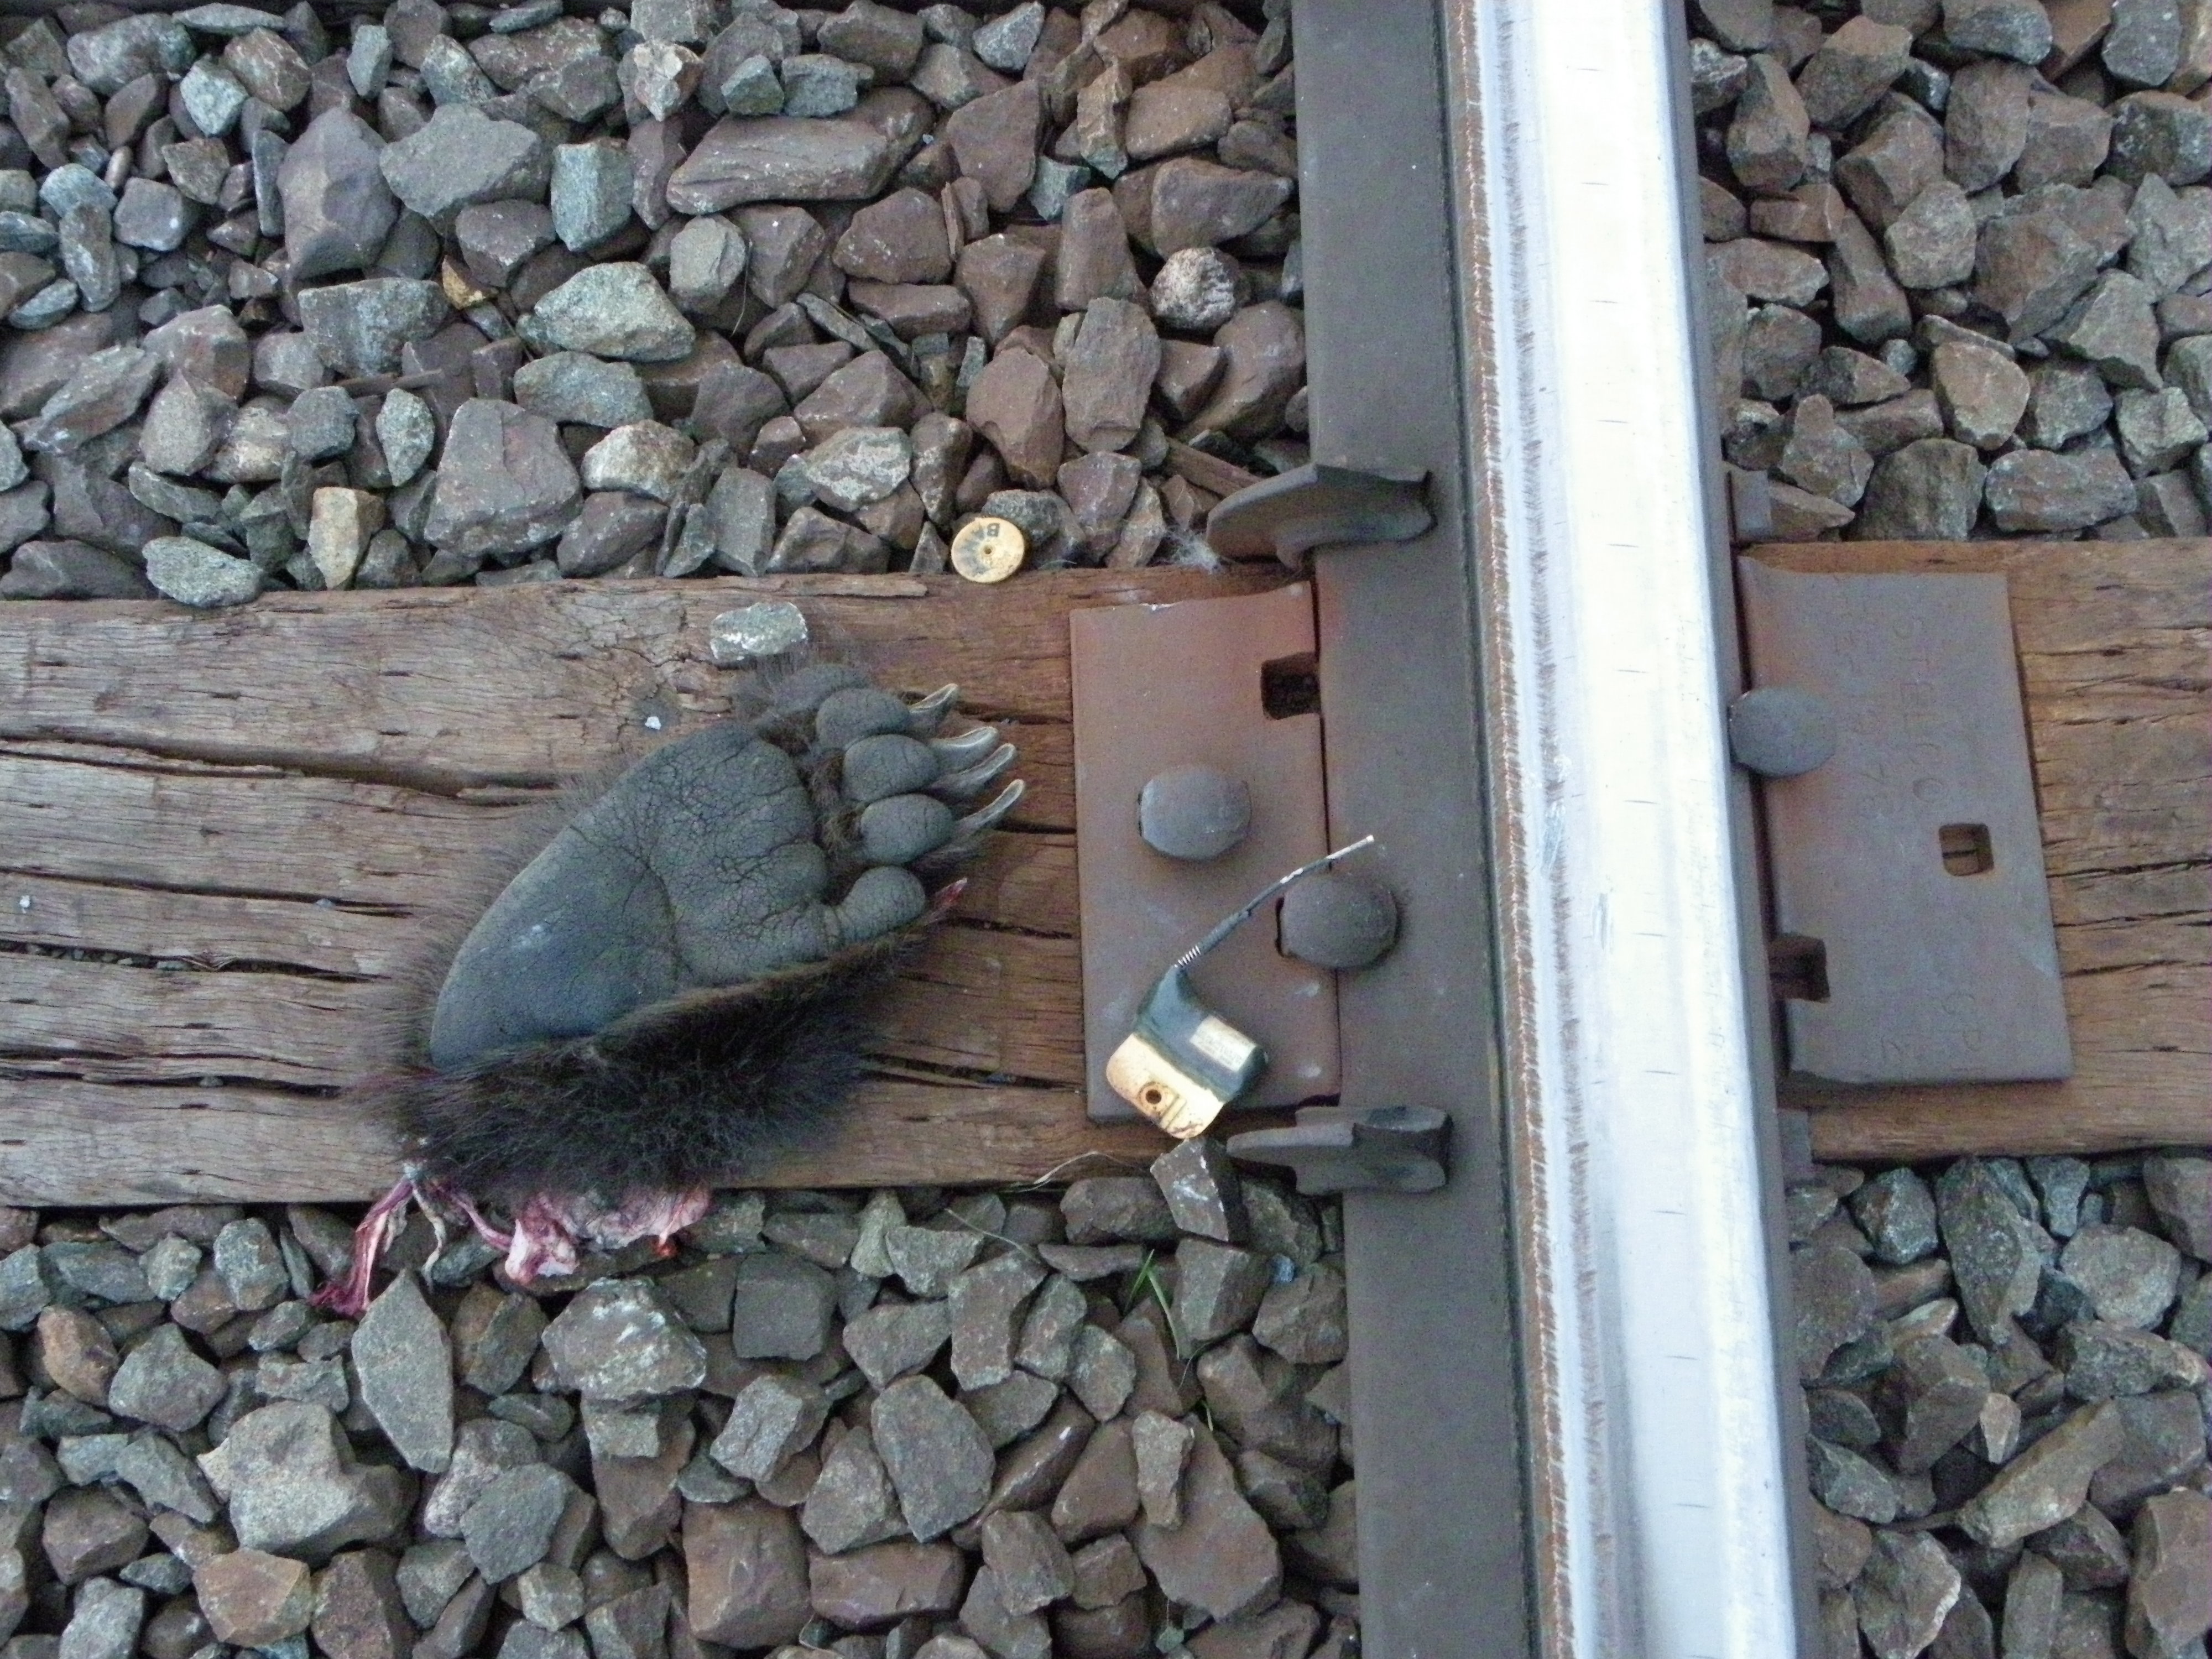
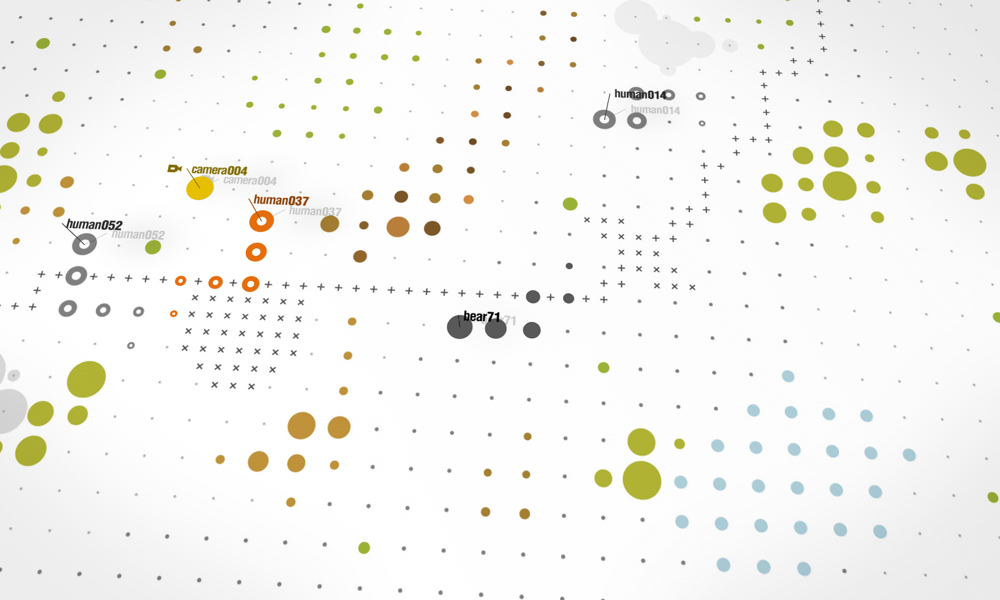
Animals, vegetables and minerals take the form of icons and pixel patterns, and viewers uncover surprises such as highways, animal overpasses, train tracks (a key antagonist in the story), and other users navigating the site in real time. Many of the elements lead to deposits of photos from surveillance cameras, accompanied by facts and statistics.
![]()
Over time, the trail of Bear 71 herself leaves its mark across the landscape. Should you follow her avatar, she leads you to content relative to the story as it unfolds.

Over time, the trail of Bear 71 herself leaves its mark across the landscape. Should you follow her avatar, she leads you to content relative to the story as it unfolds.
Click to view as a slideshow — browser screenshots — exploring The Grid


Let’s get technical
The voxel engine
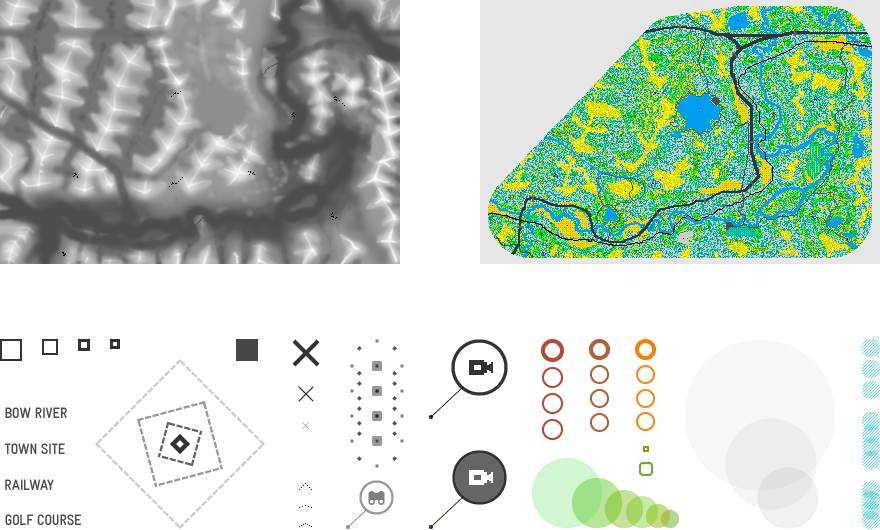
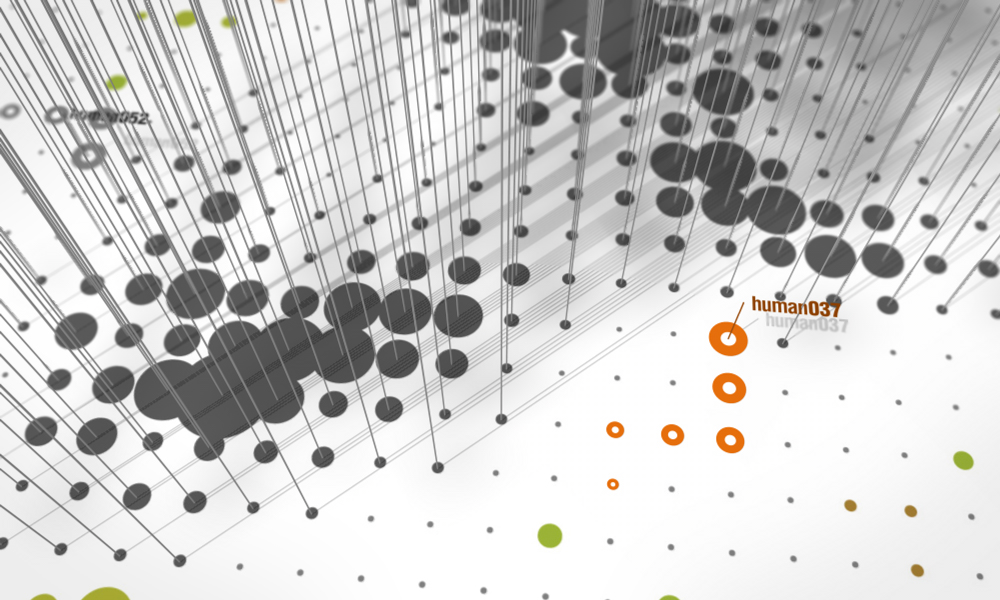
To create The Grid, Jam3 provided a 3D “volumetric pixel” engine that was my tool for designing and building the landscape: I drew a depth map to control the topography, and a colour map to associate each pixel with custom-built icons. The model needed specific features to accomapny poignant moments in the narration (i.e. highways), a natural terrain that nods towards Banff Park, and enough distinguishable elements and icons to be identifiable and busy, but not overwhelming.
Jam3’s voxel engine build tool
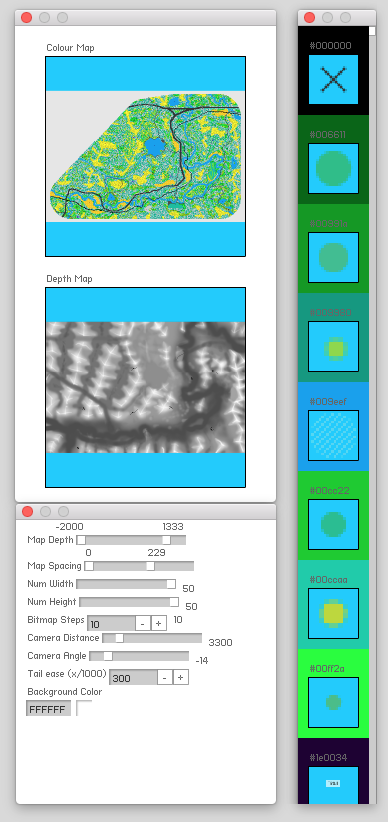
Some of the files loaded into the Jam3 voxel engine
It took me by surprise
Fullscreen video
It is the audio — the voice of Bear 71 herself, sound effects and music by such bands as Radiohead and Sigur Rós — that leads the viewer from chapter to chapter. At key moments, this linear progression triggers fullscreen videos, which lend emotional impact to the story.
Video — browser screencast of a Bear 71 fullscreen video moment
Click to view as a slideshow — various screenshots of fullscreen video moments


The cameras saw it happen
Surveillance screen
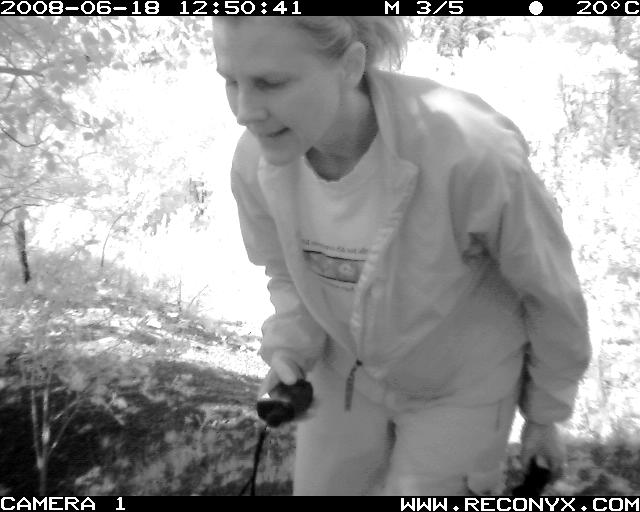
If viewers permitted the site to access their webcams, they became a part of The Grid's surveillance system, and shared in the vulnerability of being observed and tracked, alongside other real-time users. (This feature has since been disabled, though the surveillance screen is still available.)

Jeremy Mendes, International Documentary Association interview

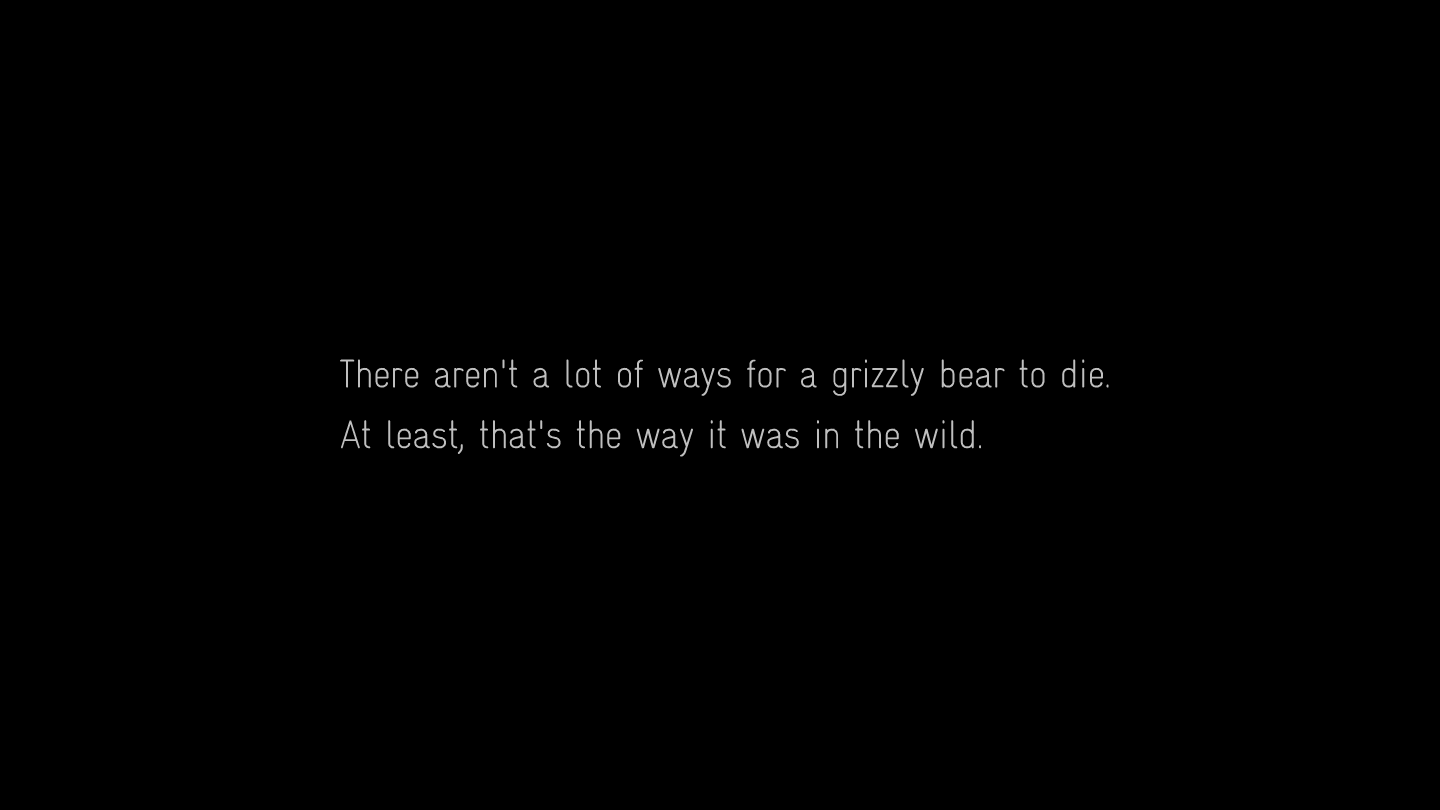
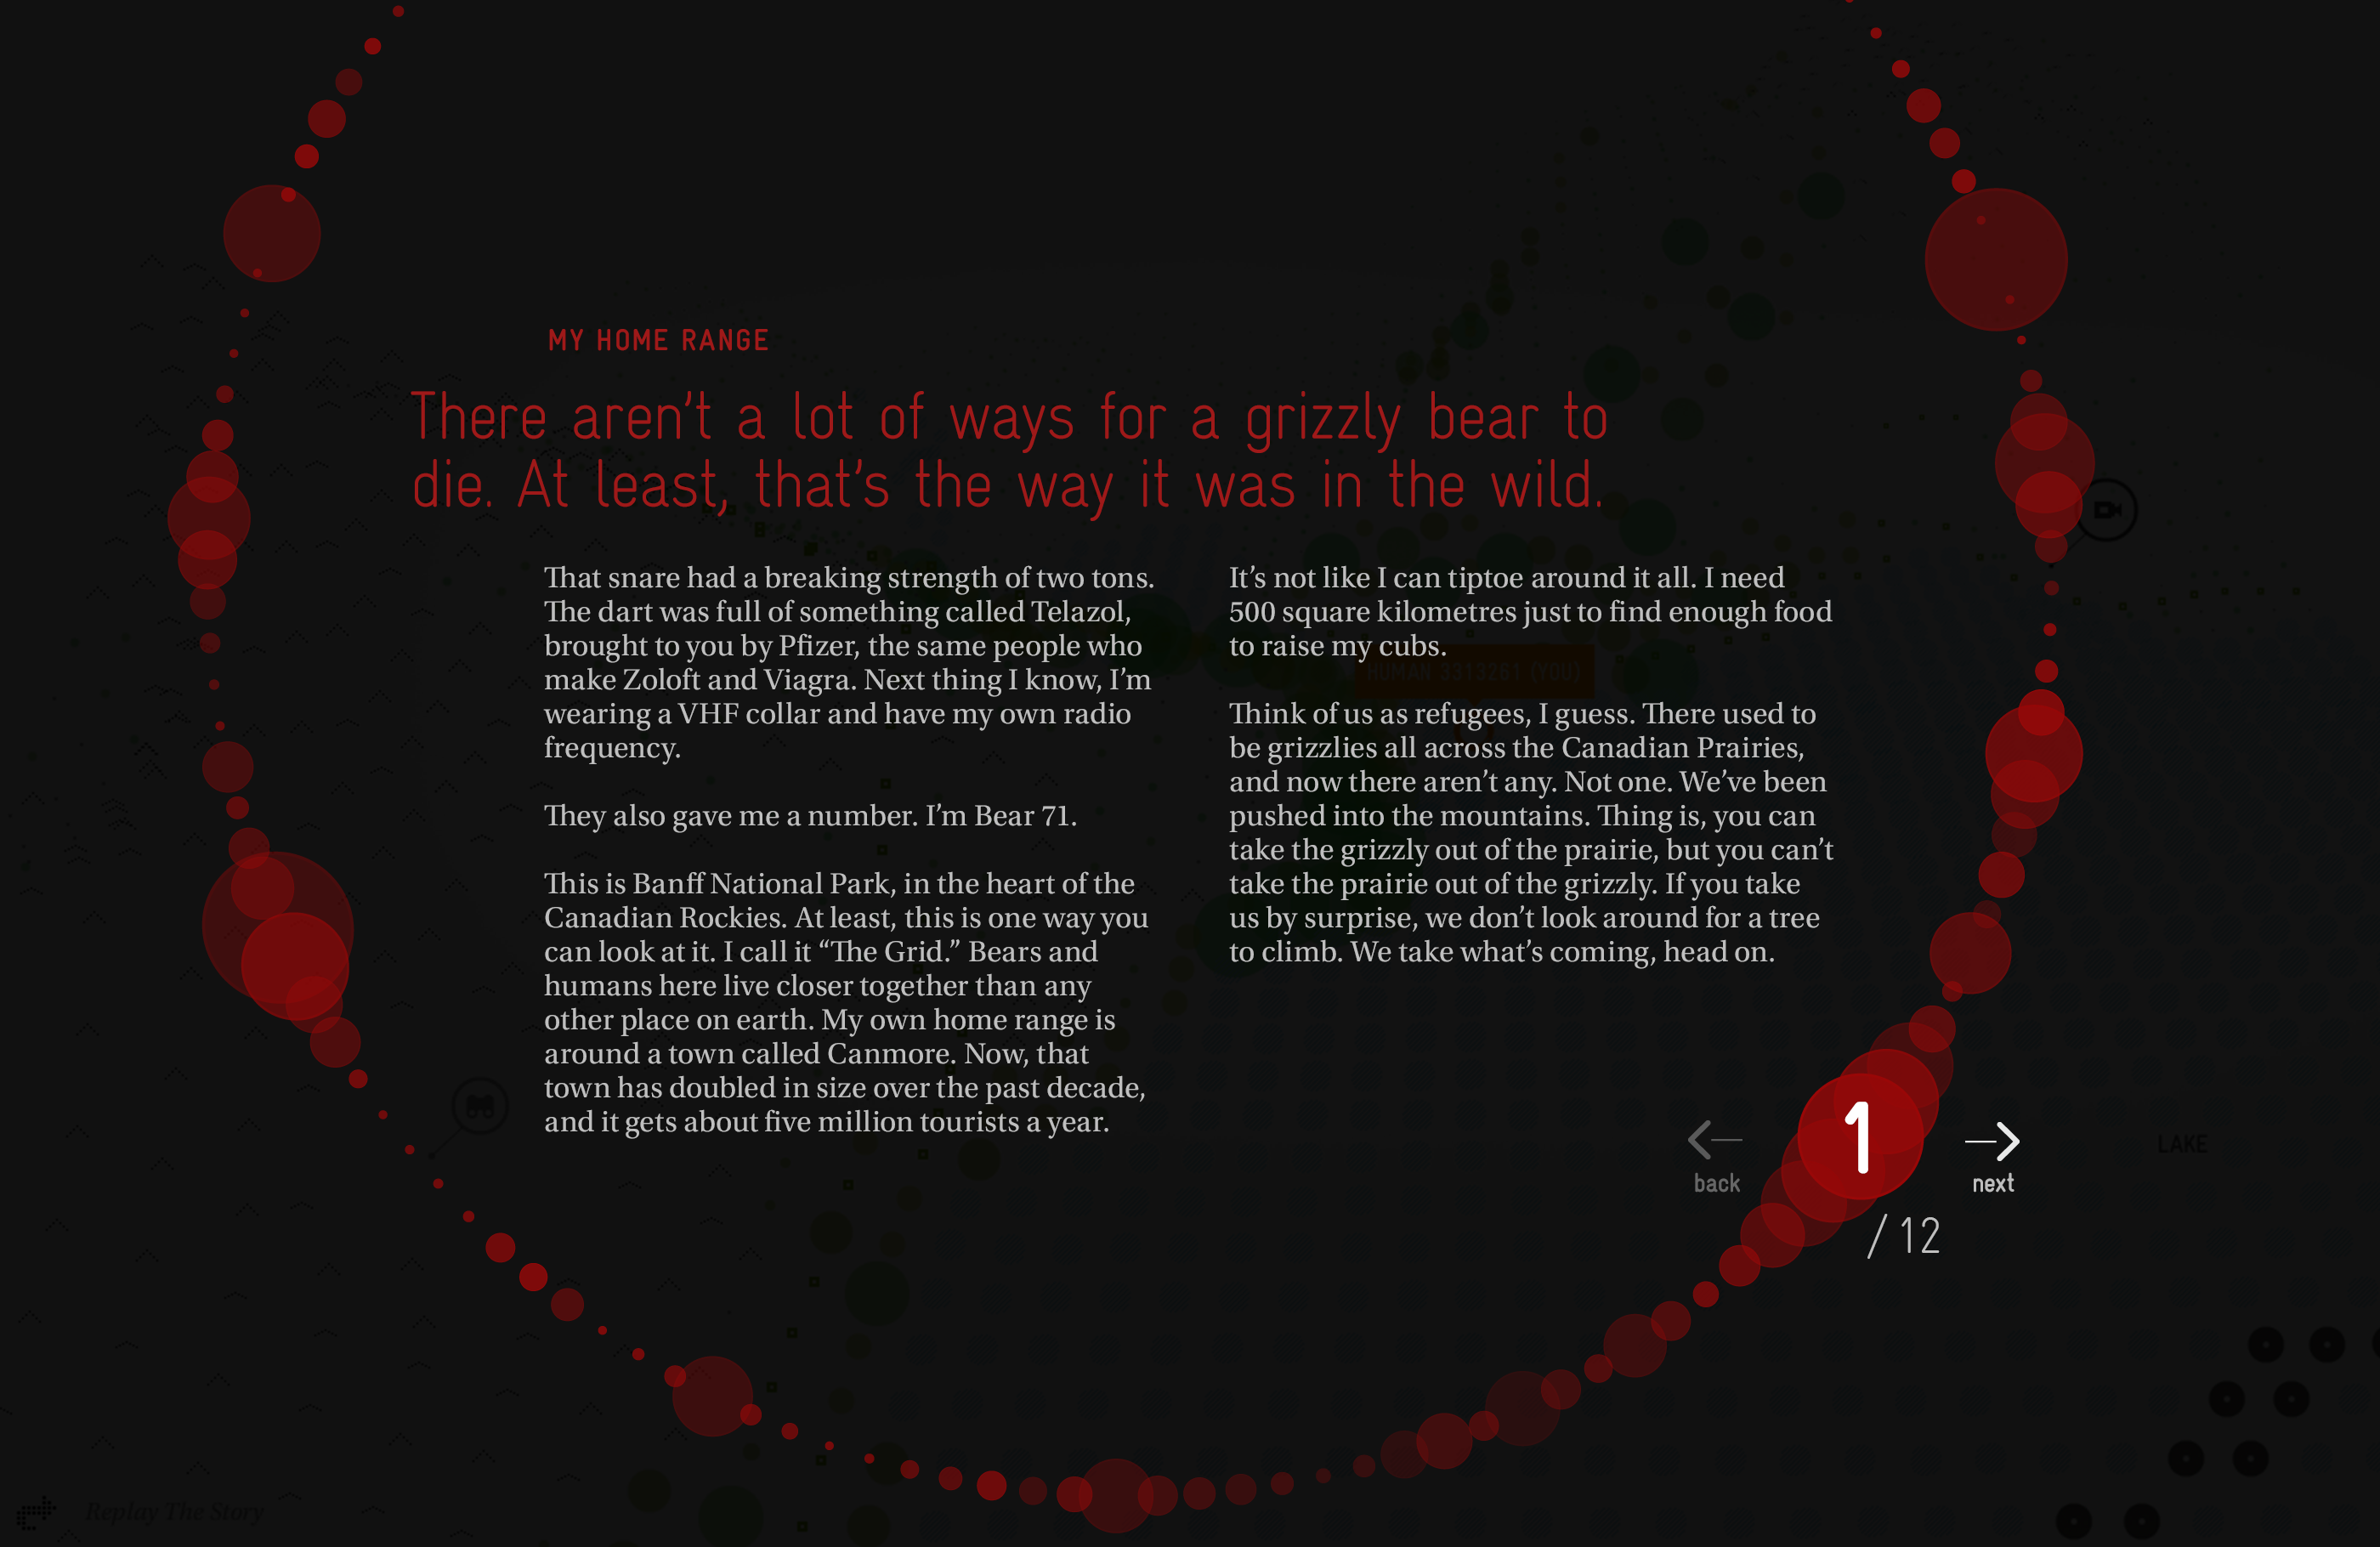
Ways for a grizzly to die
Site opening
The opening moments of Bear 71 deliver an announcement on the length of the story, a preloader that hints towards the surveillance wall buried in The Grid’s interface, an animated wordmark, and a video introducing the audience to the protagonist. When it’s done, the viewer is dropped into The Grid, as a character. (The wordmark sequence was designed by Patrick Johnson.)
Click to view as a slideshow — screenshots of the site’s opening sequence


Video — Bear 71's opening sequence
Put that in your notebook
Support screens
A read through Bear 71’s background is available, as is J.B. MacKinnon’s script (the site’s audio narration).
Click to view as a slideshow — some final comps for the Script + About screens


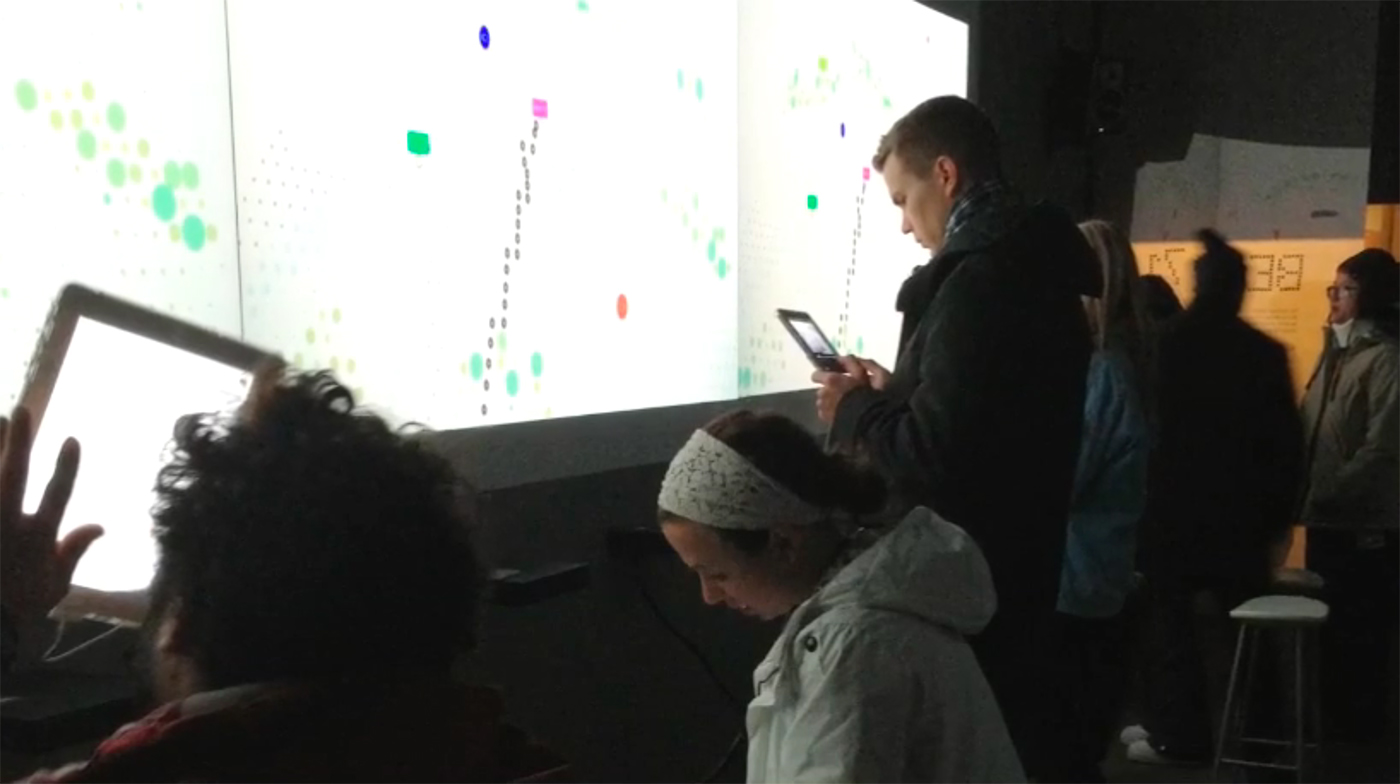


Click to view as slideshow — installation + festival photos
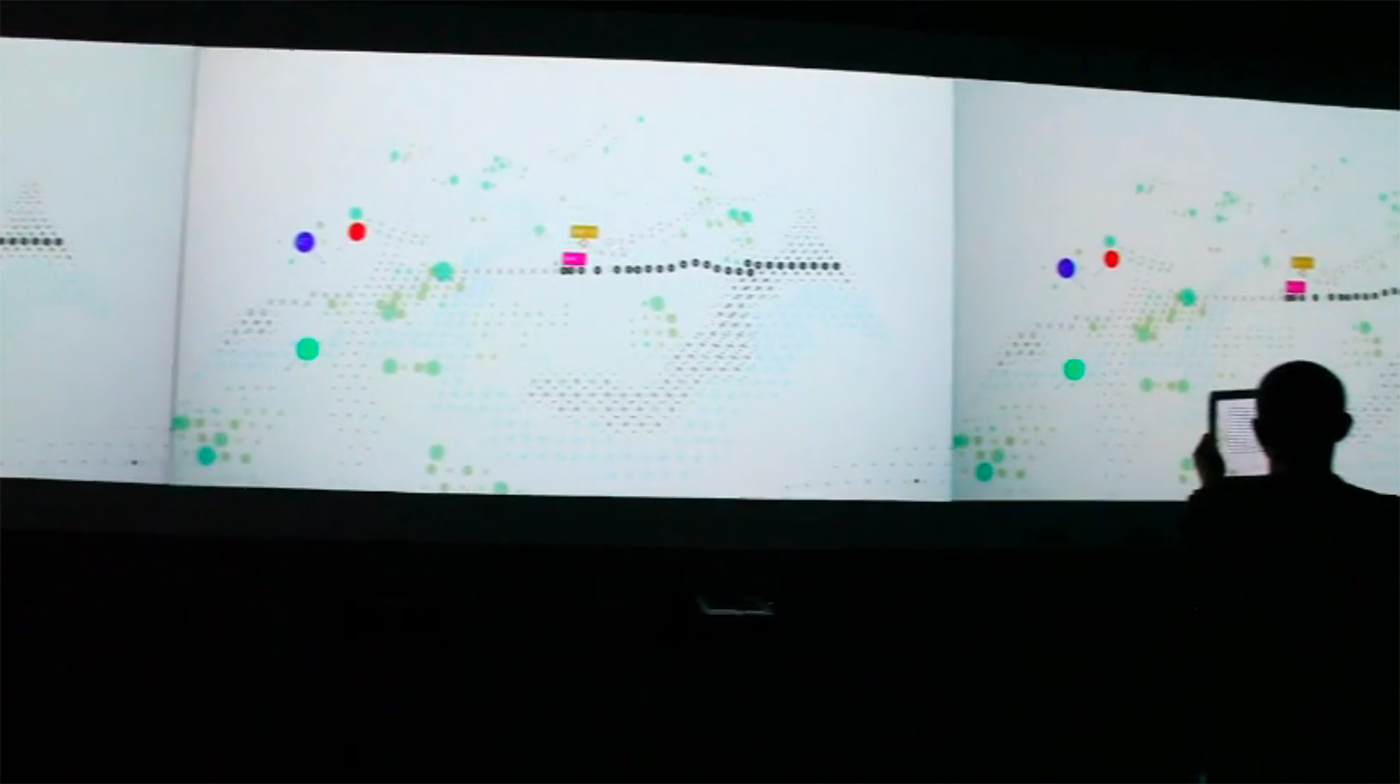
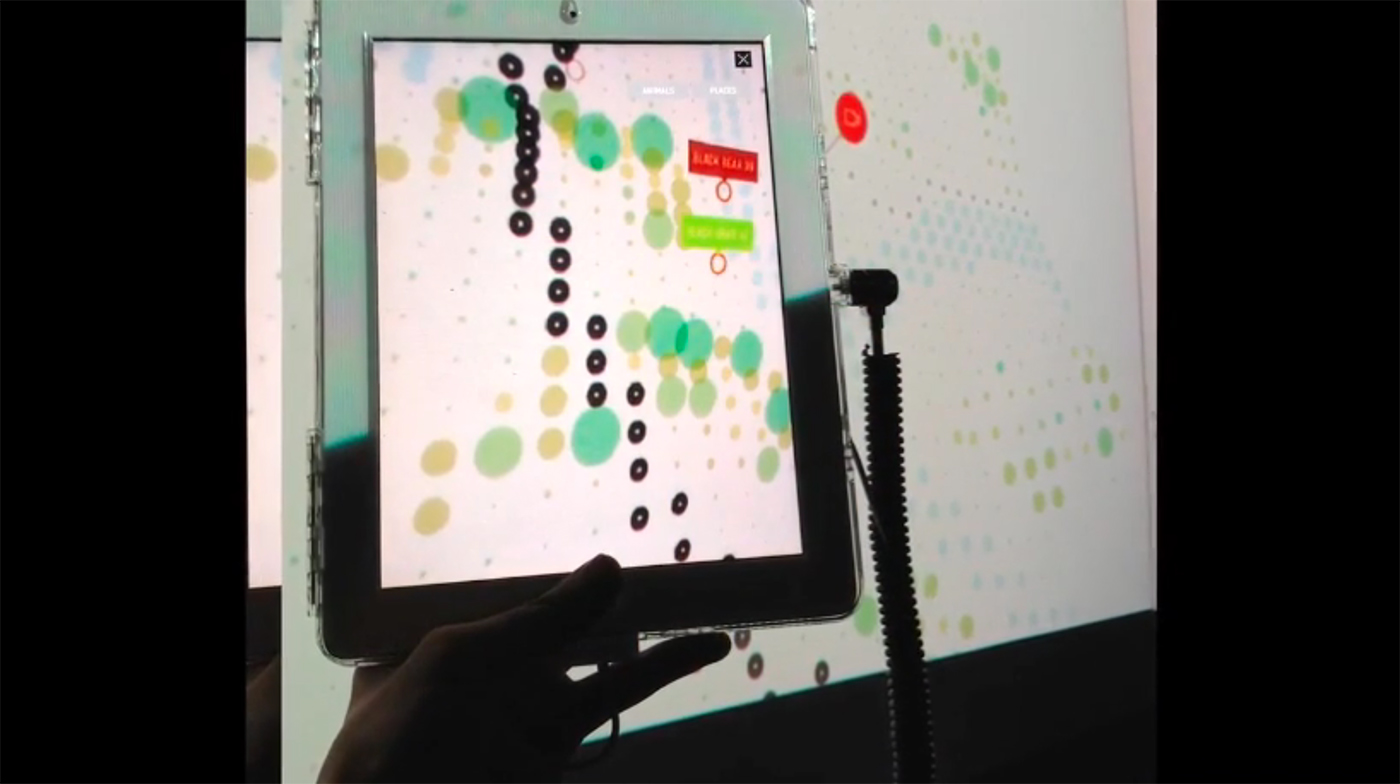
More than just a website
Installation + social narrative
Bear 71 launched in 2012, in conjunction with an installation at the Sundance Film Festival. Co-created by Lance Weiler, the installation included three large screens, surveillance cameras and an actual tree from Banff Park, and used facial recognition, motion sensors, and an augmented reality iPad app serving as the viewer’s controller. Later in the year, the experience travelled to the Utah Museum of Contemporary Art, and a public performance, with live musical accompaniment, opened the 2012 DOXA Film Festival in Vancouver.
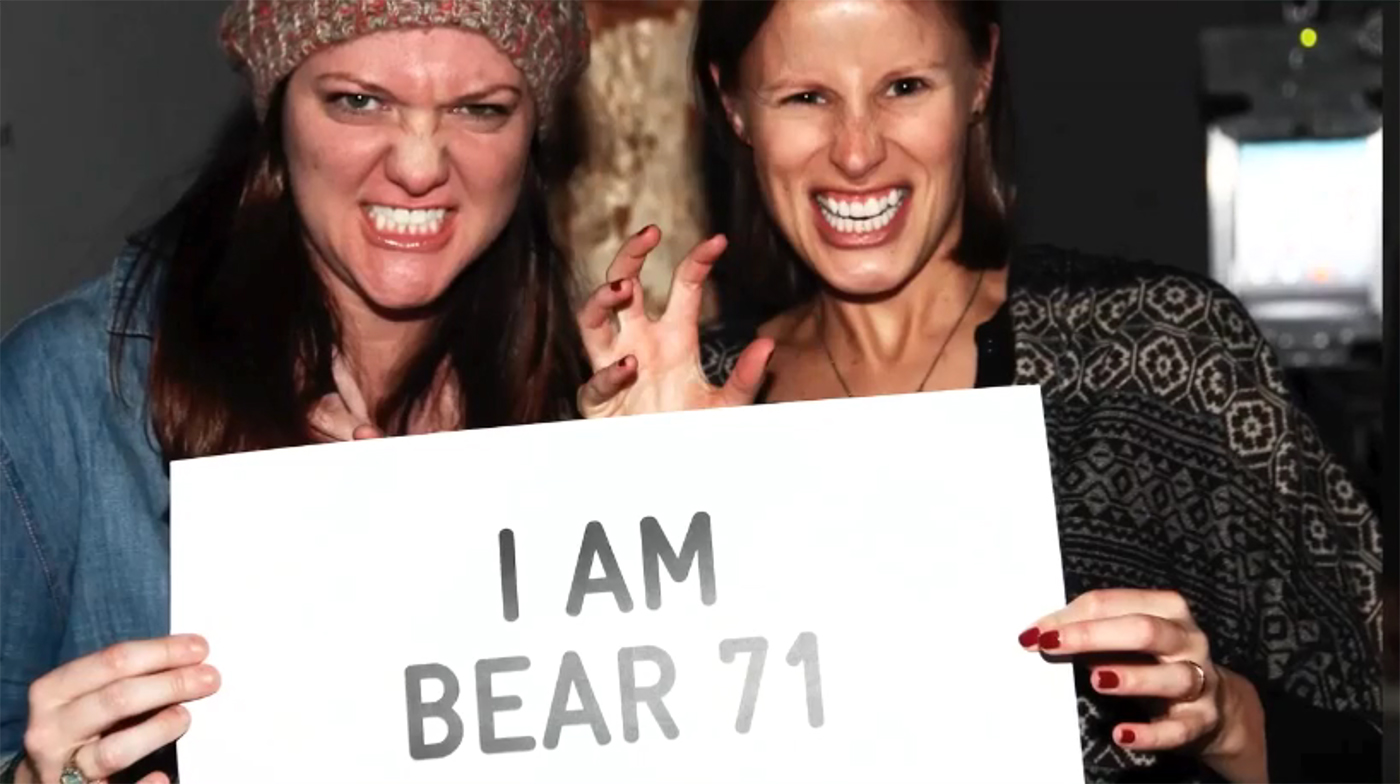
A social media campaign also supported the project, centered around @iambear71 on Twitter, a Tumblr blog, and a microsite where visitors could role play as one of Banff’s wired wild animals. The installation and support sites helped infuse Bear 71 with a social narrative raising awareness about the intersection of animals, humans and technology.
Bye-bye Flash
Bear 71 VR
In 2017, the NFB partnered with Google to modernize Bear 71 for current web technologies, turning it into a virtual reality experience → Bear 71 VR. Same storytelling experience, though the visuals have been slightly updated, and The Grid is more dense. I wasn’t involved in this incarnation of the project, though I like to think I had a hand in the art direction ;)
Title screen for the 2017 recreation of Bear 71

Back to the beginning
Project initiation
My introduction to Bear 71 was a debriefing with co-creator Jeremy Mendes where he explained the seed of the project (Leanne Allison’s thousands of hours of wildlife footage) and outlined his vision of a data-point landscape, a recreation of Banff National Park that could serve as an explorable infographic.


Wireframing + visual language
My first task was to piggyback on the wireframe work that Jam3 had already produced, and to iterate through some UX troublespots. For instance, there were potentially awkward moments when the audience was viewing random pockets of Grid data (stats, camera footage), while the narration also needed to force other timely + specific content to the forefront.
Click to view as a slideshow — wireframe samples

In tandem with the wireframing, I began to generate ideas and source reference imagery for designing our interactive infographic, The Grid.
A Bear 71 moodboard

Through the lens of technology
Design exploration
The design exploration phase for Bear 71 was long and in-depth. It felt like we were breaking new ground, and there simply weren’t many other projects we could reference for guidance. Every answer led to more questions, and there were many moments of “will this actually make sense to anyone?!”
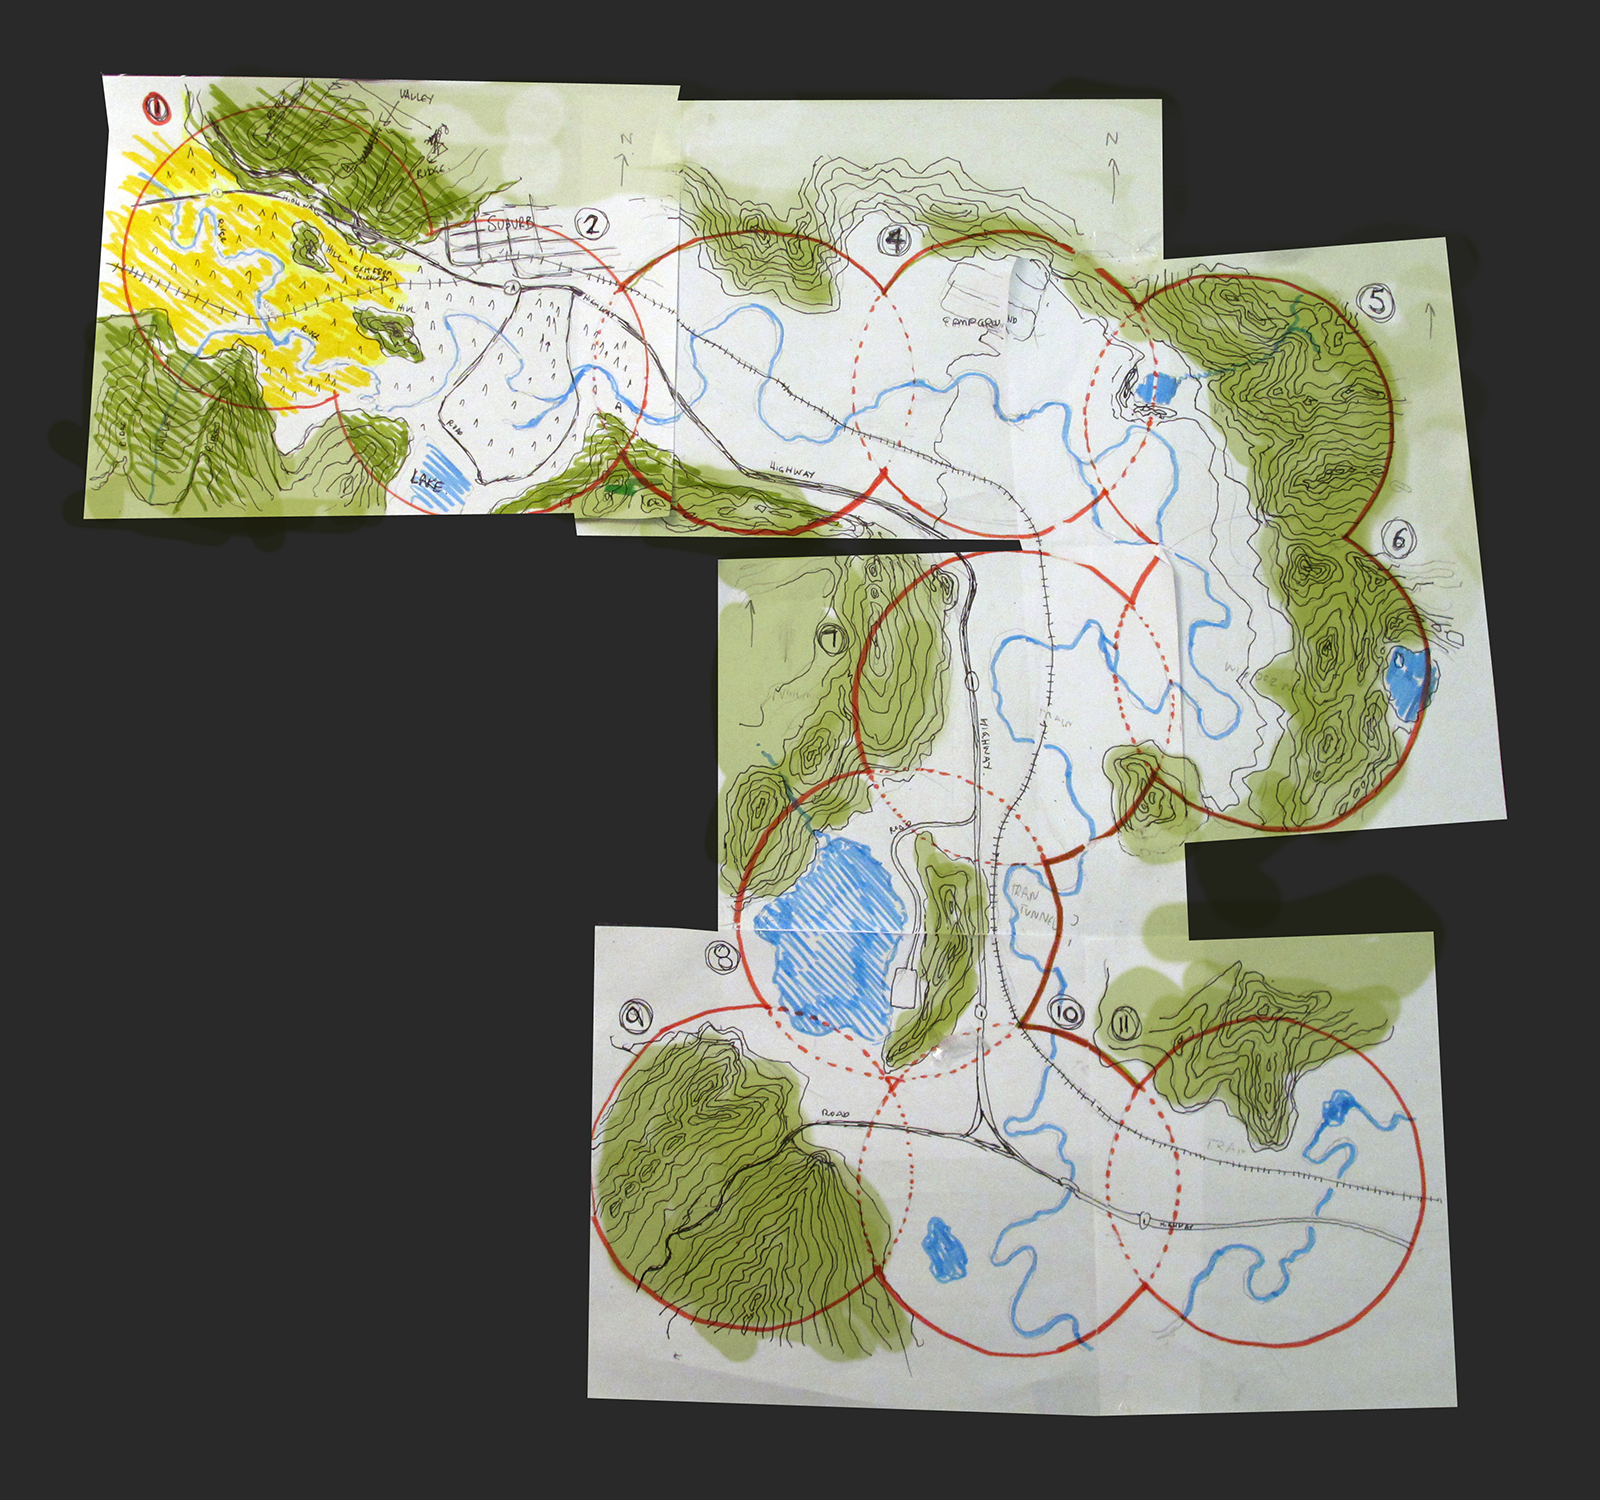
The grid
Early iterations of The Grid were much more flat, with only subtle 3D topographic displacement. The intention was that you were navigating a big map pulsing with ever-collecting data points. Interestingly, the colour scheme — a largely analogous palette reminiscent of some Charlie Harper work — would remain fairly intact throughout the project.
Click to view as a slideshow — early Grid designs


Topography + Parallax
I tried varying the z-space positioning of Grid elements to explore the feel of topographic displacement, as well as the parallax effect that would result with camera moves.
Video — Grid parallax + topography
Click to view as a slideshow
![]()
![]()

Scanning The Grid
An early idea explored in design was that, every so often, The Grid is “scanned” — a visual depiction of the system taking inventory of its contents and a heavy handed reminder that Big Brother is present. This condition didn’t make it into the final build, but it did show up in the 2017 VR version.
Click to view as a slideshow


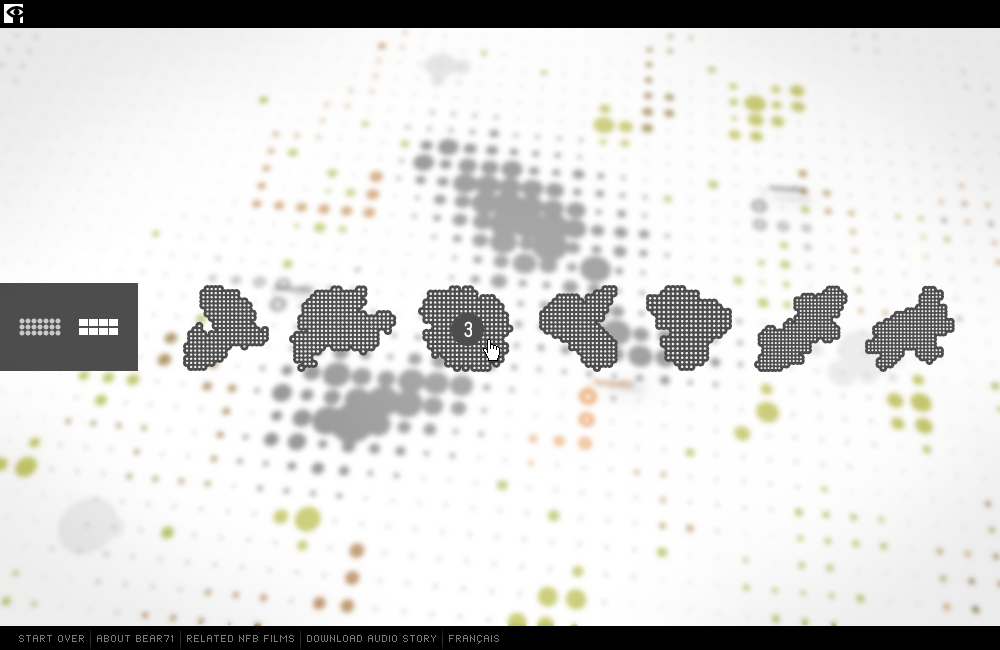
Navigation
While the audio narration would tell a linear story, we wanted to include the ability to jump from chapter to chapter. Here are some early iterations.
Slideshow — navigation UI

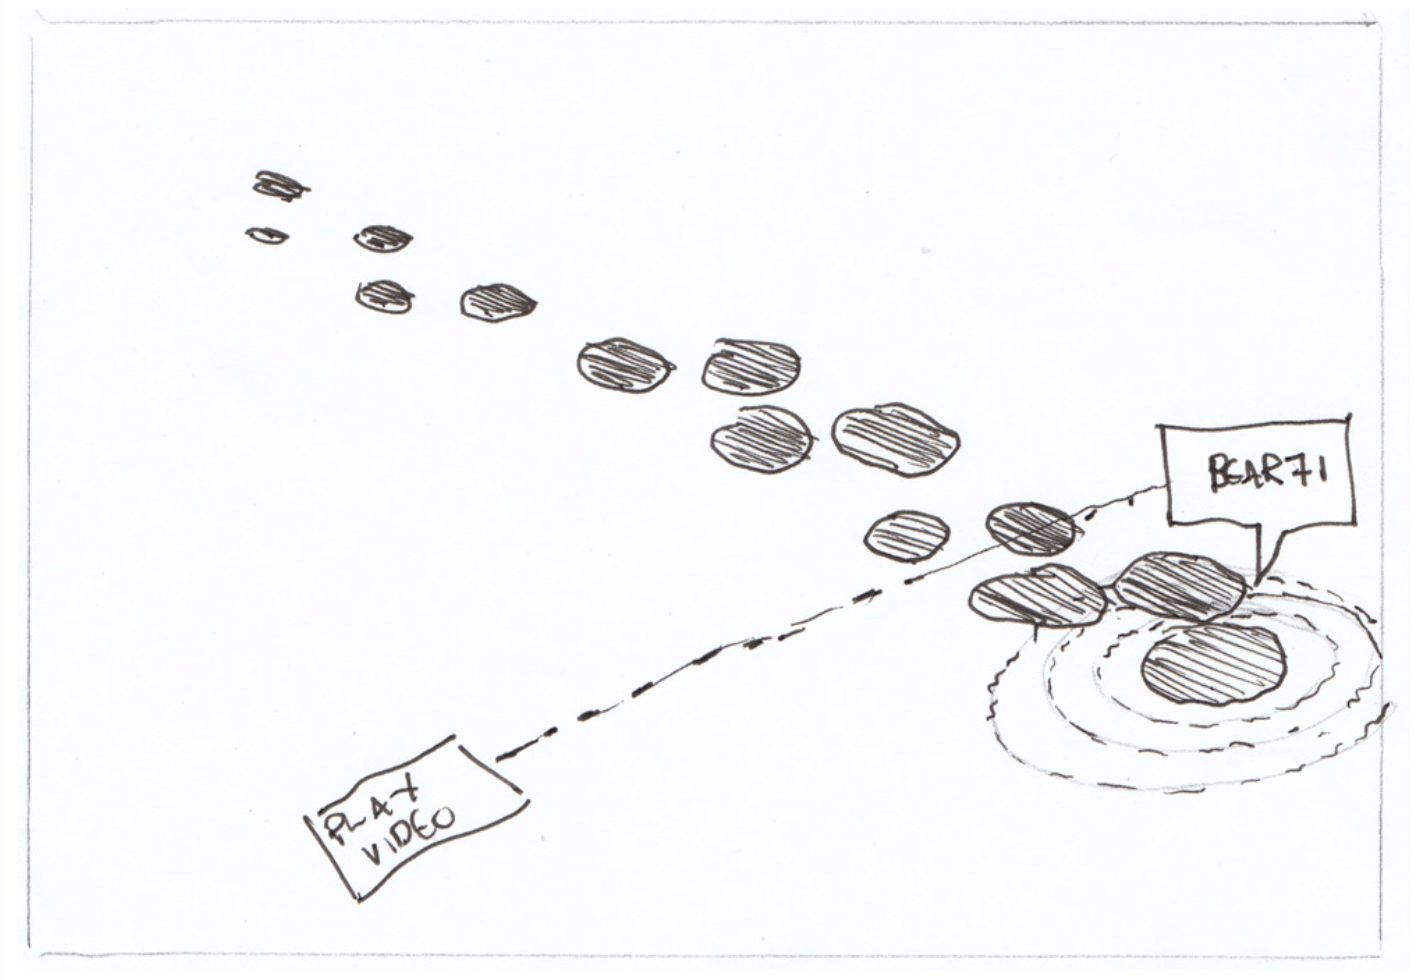
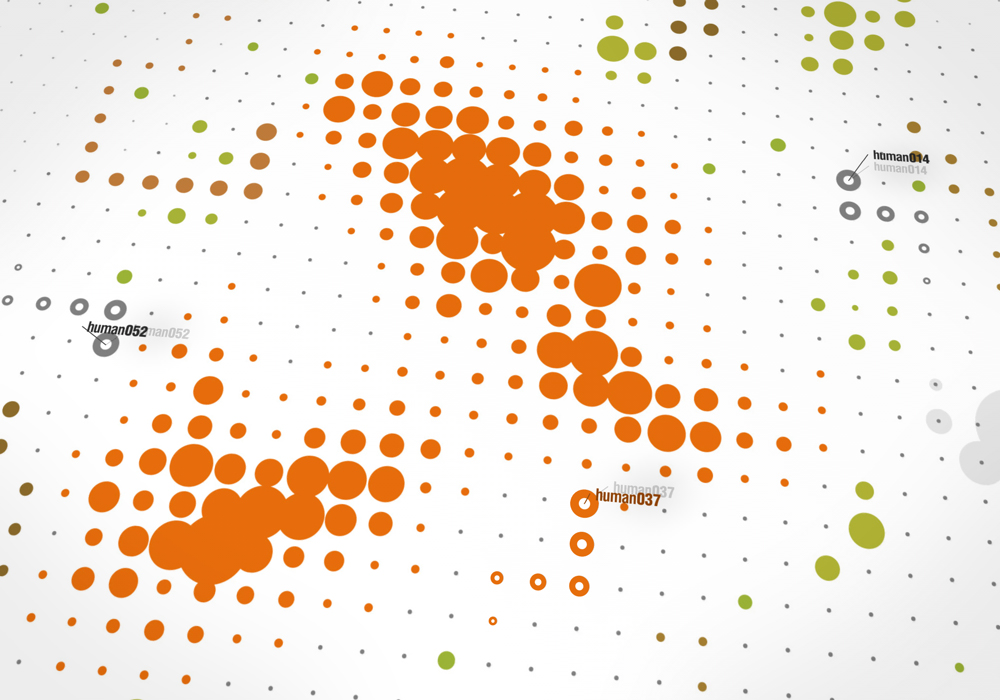
Trail camera caches
From day one, The Grid was to provide access to Leanne Allison’s trail camera photos. An initial idea was that by travelling close to a concentrated data point cache (the collection of dark dots), viewers would activate the trail cam stop-motion sequences.
Slideshow — accessing trail cam photos


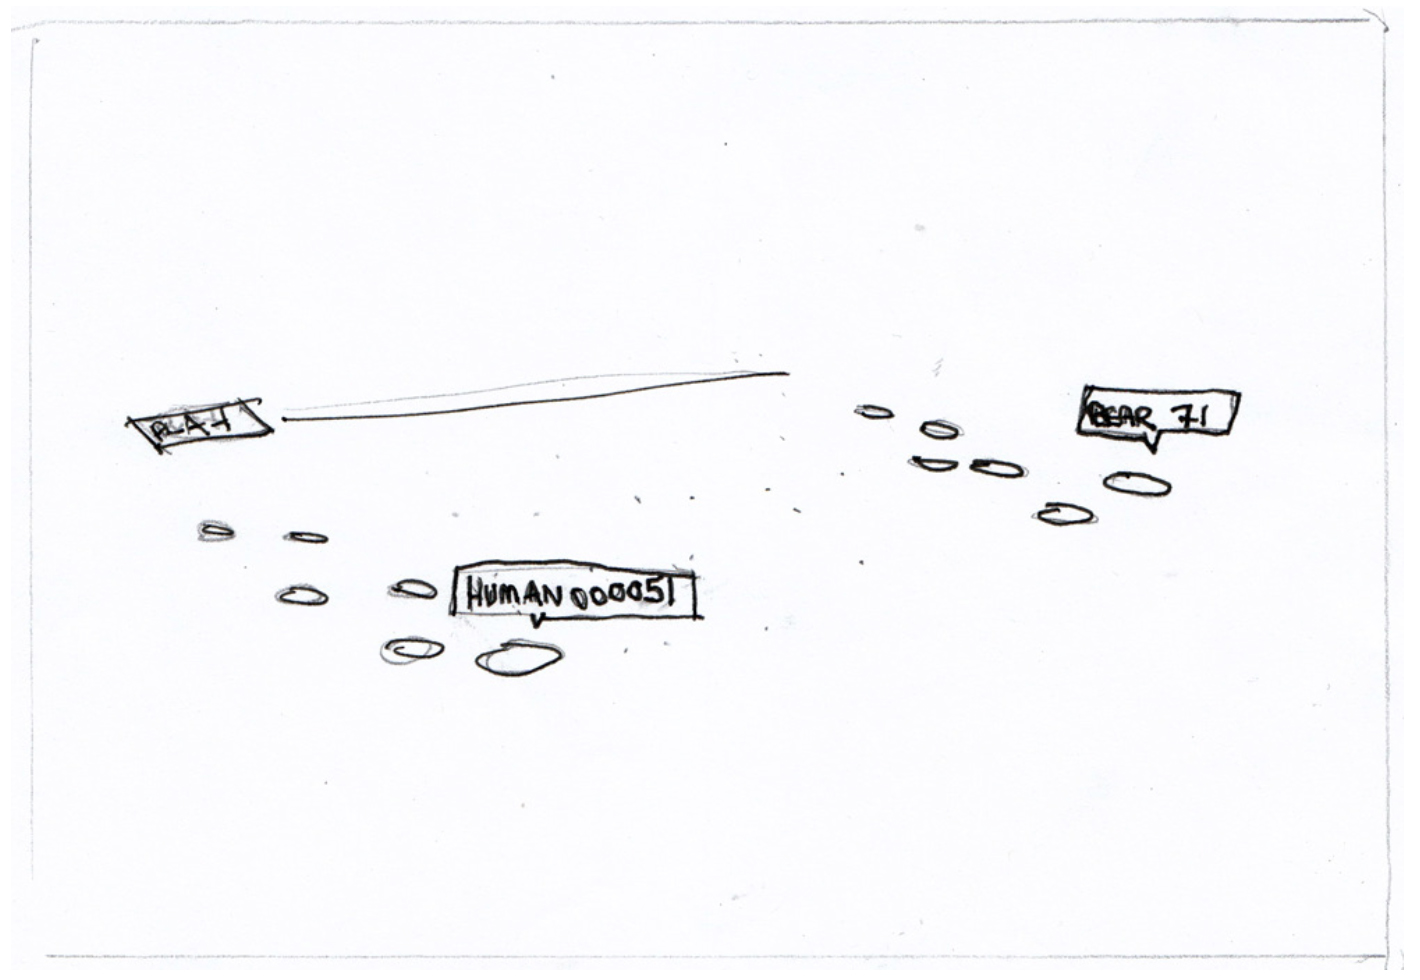
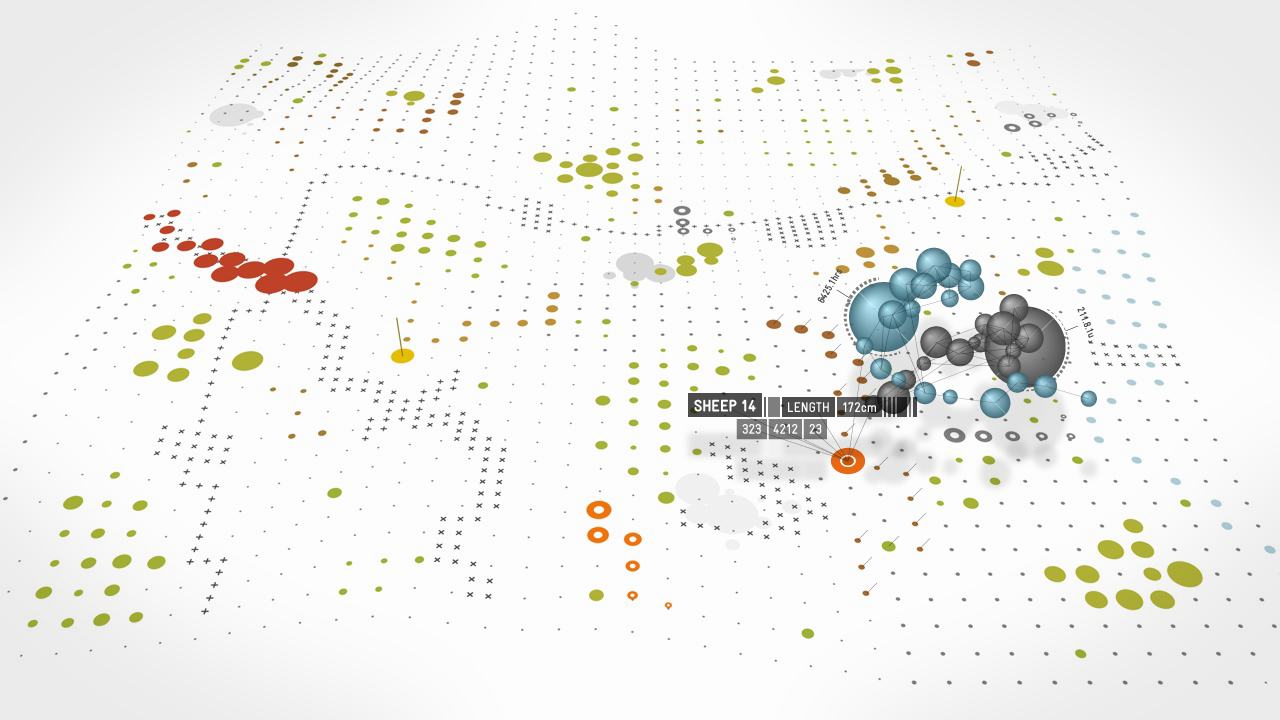
Support data
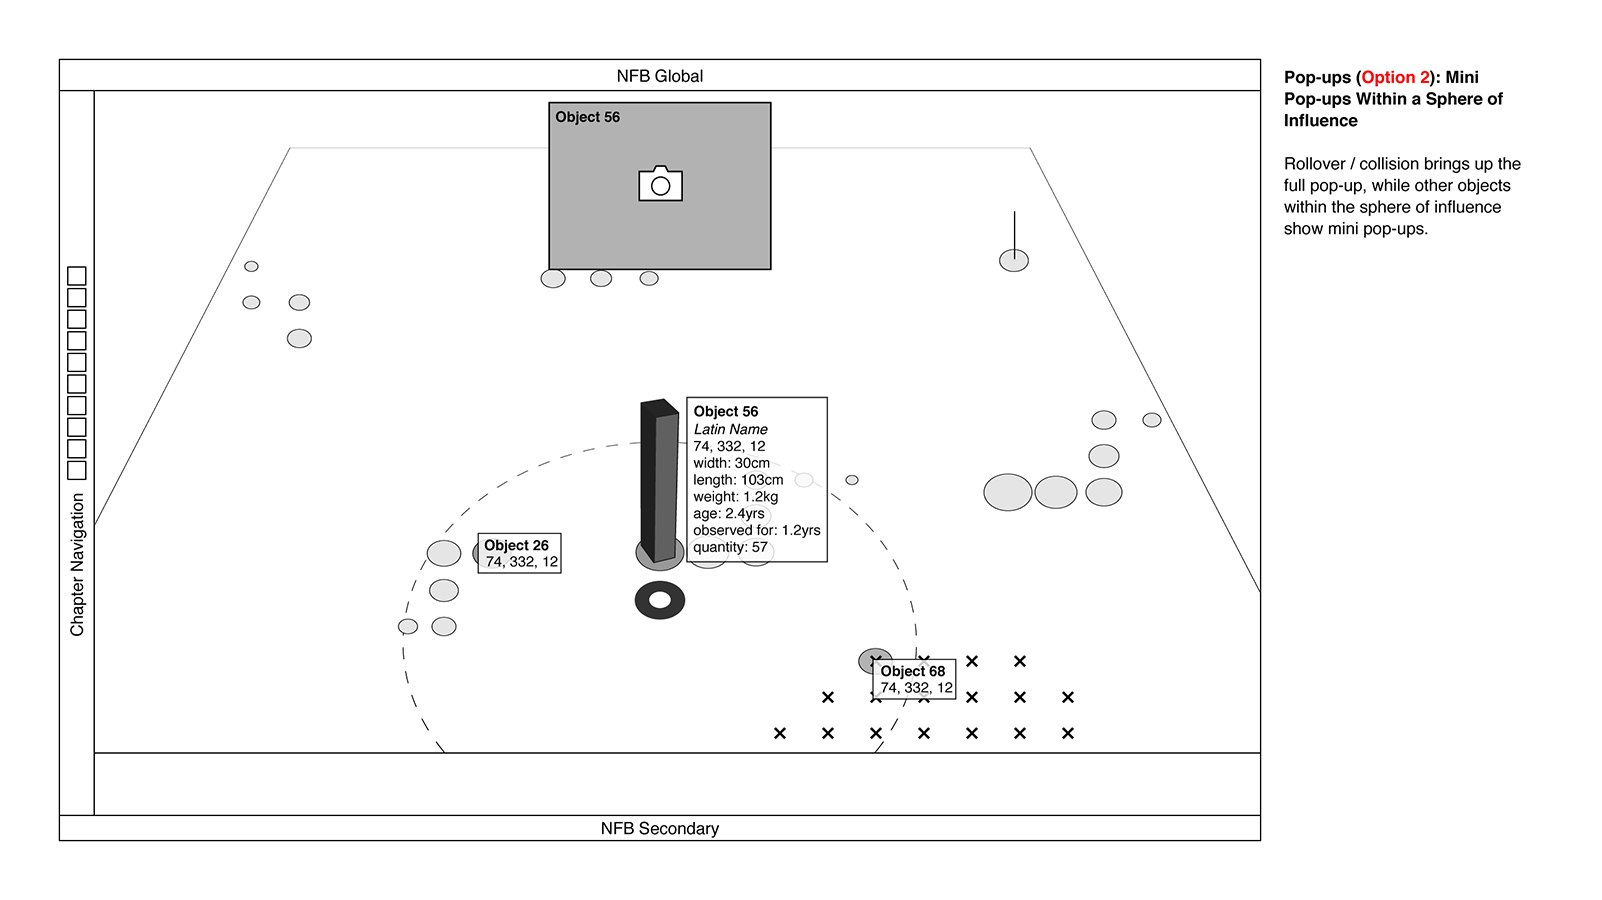
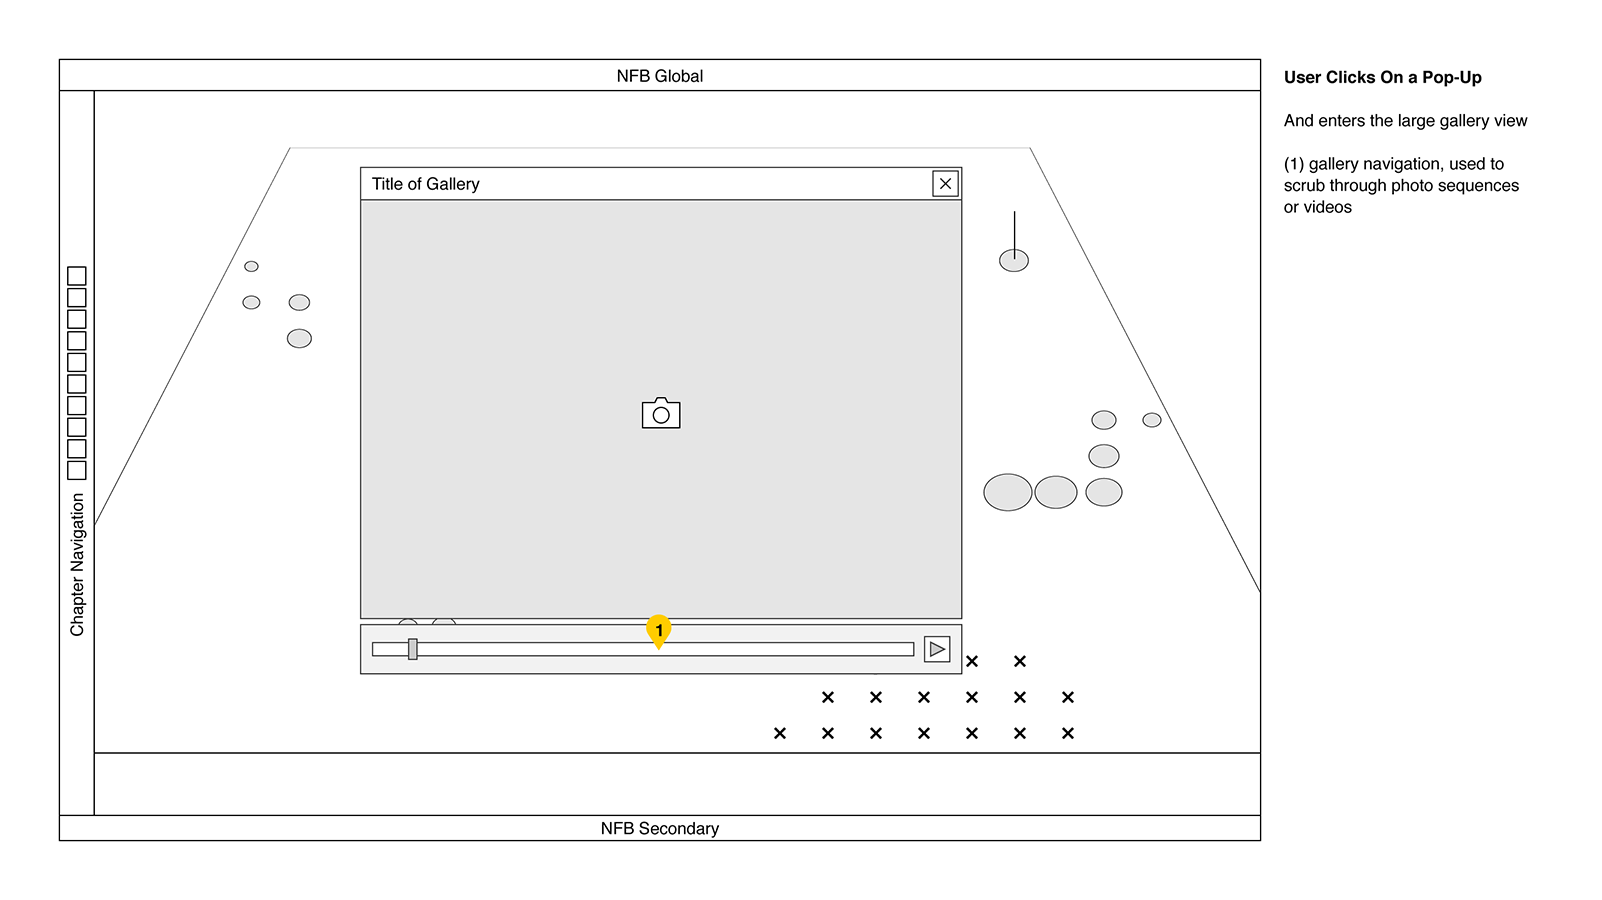
The audience would also see support data for the characters on The Grid — facts, statistics and more imagery — and we played with various visual ways to pull this off.
Click to view as a slideshow


Character movement
The movement of animals, humans, cars and trains would play a large role in explaining the actors on The Grid, and in bringing the storyworld alive. Each character would have its own rules for movement: speed, smoothness and range.
Video — animal motion test
Opening title sequence
For fun — long before the wordmark or Grid design had been established — I mocked up a title animation using The Grid styles and scan poles we’d been playing with in the exploration phase.
Video — opening title sequence
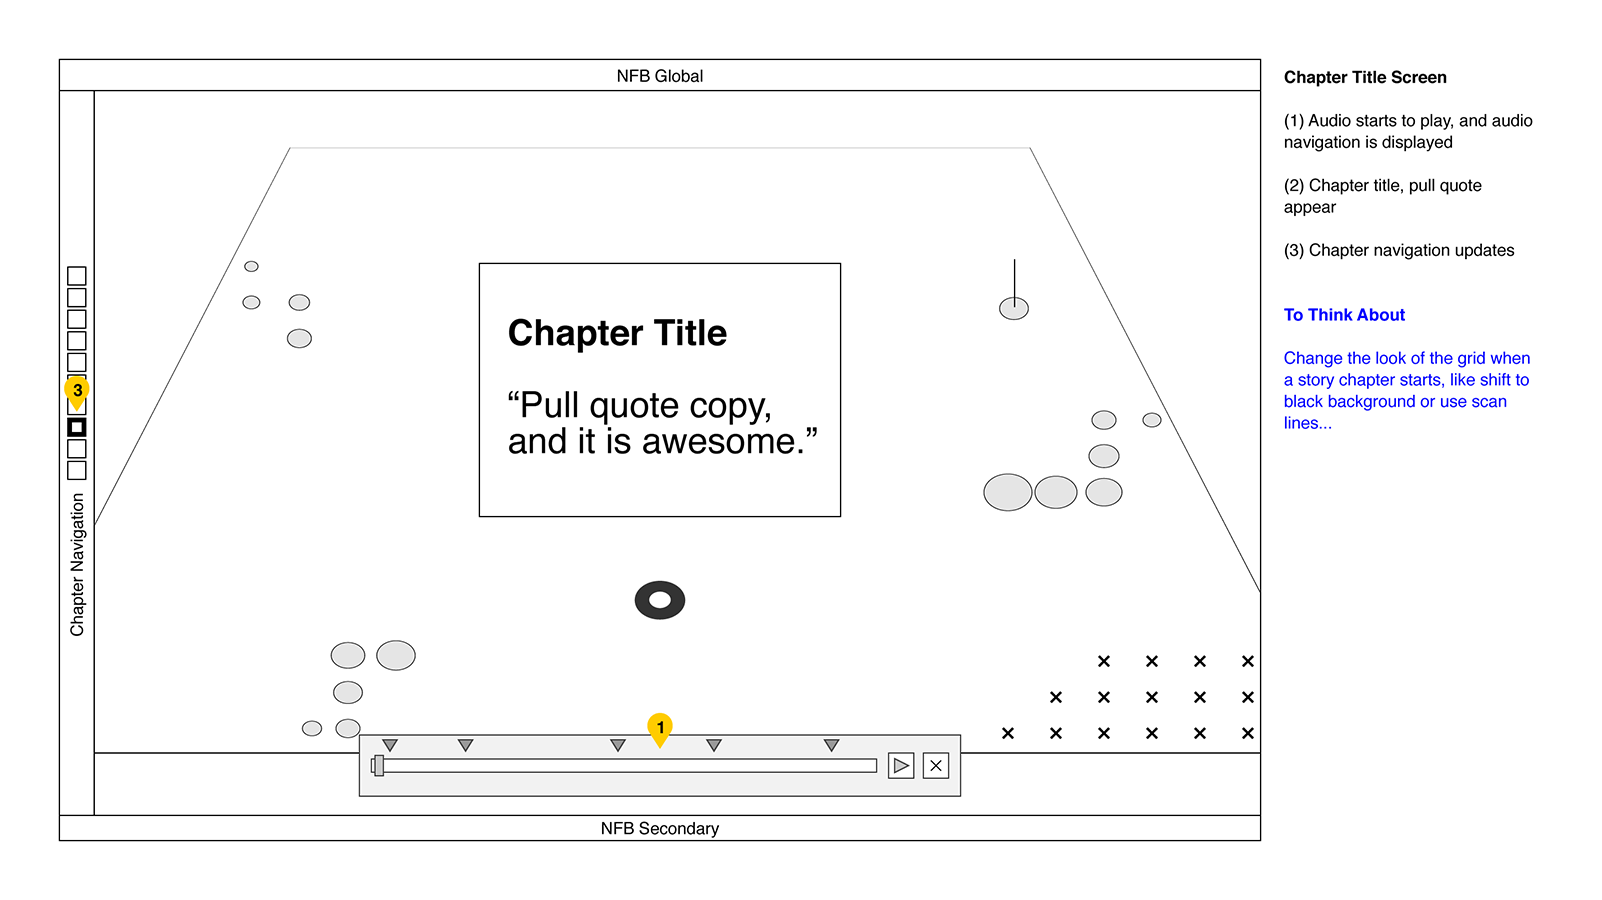
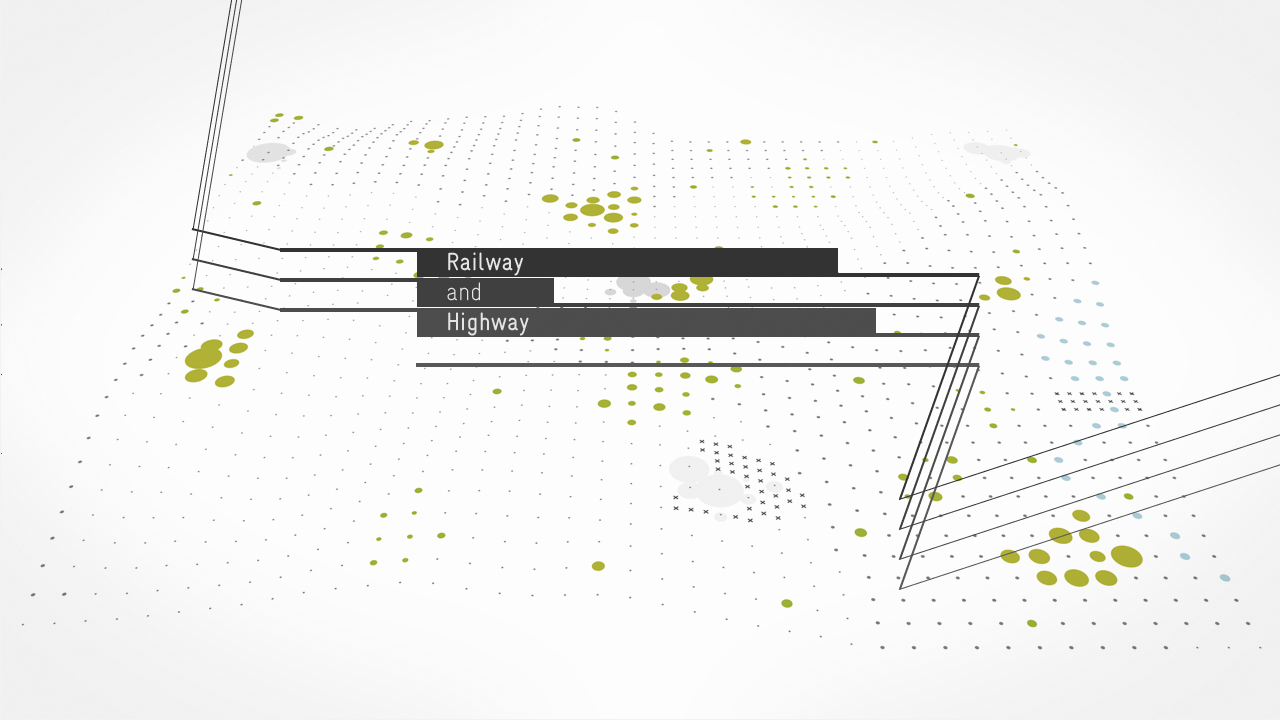
Chapter titles
Finally, I also explored text treatments to announce the beginning of new chapters in the narration. In the end, we chose to simply roll from one chapter to the next, and make the division less apparent.
Click to view as a slideshow — chapter title iterations


Experience Bear 71 ↗