The Coho DataStream
Modernizing data management
The management of enterprise-level data storage is a highly technical, granular and multi-layered service. And yet Coho Data wanted their web app to be simple, smart, and intuitive. Challenge... noted.
Type
Web app, tablet app
View it
n/a
Agency Direct client
Web app, tablet app
View it
n/a
Agency Direct client
Role
UI art direction + design (research, visual concept, style guides, layout, typography, iconography, interaction + animation samples)
Collaborators
Andrew Warfield (Coho CTO) // Michael Welsman-Dinelle, Alex Bradley (developers)
UI art direction + design (research, visual concept, style guides, layout, typography, iconography, interaction + animation samples)
Collaborators
Andrew Warfield (Coho CTO) // Michael Welsman-Dinelle, Alex Bradley (developers)
Coho say what?
The product
From 2011-2017, Coho Data provided “big data” enterprise storage solutions. Its mission: bring the efficiency and flexibility of the public cloud (think Dropbox) into the big leagues of on-premise data centres (IBM, EMC), where performance and control are crucial.

Coho sought to eliminate much of the technical / hardware know-how that customers had traditionally needed, and in turn provide:
- the invisibility of cloud-based services, where provisioning, management and optimization are largely handled for the user, behind-the-scenes
- simple plug-and-play deployment
- easy modular scale-out — buy what you need when you need it — rather than risky forecasting and big upfront investments in hardware
Swimming upstream
My role
My challenge was to design the software UI for a highly technical service, yet have it reflect Coho’s user experience promises: simplicity, intuition, and a degree of “don’t worry; we’ve got this.”
But not so fast. The web app also needed to provide access to a granular behind-the-scenes level, for those times when, say, a distant hiccup in a single virtual machine was wreaking havoc on disk performance.
In a nutshell, show ease of use with power under the hood.

As such, each design sprint required a new round of education on my part — can read requests go to both flash and disk drives? what type of switch has a QSFP+ port? — so I could design for the user’s needs, expectations and ignorances.
How you doin'?
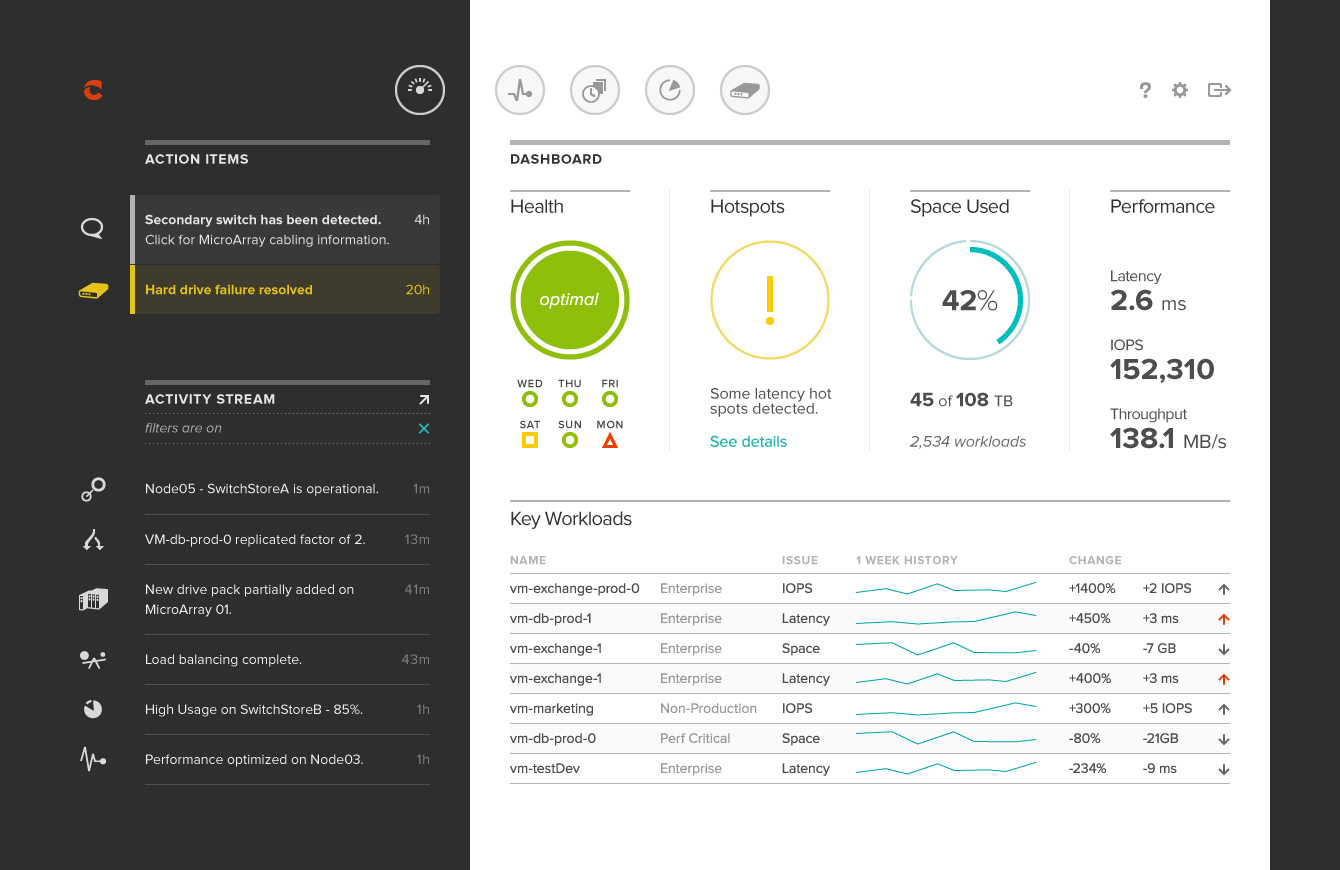
The Dashboard
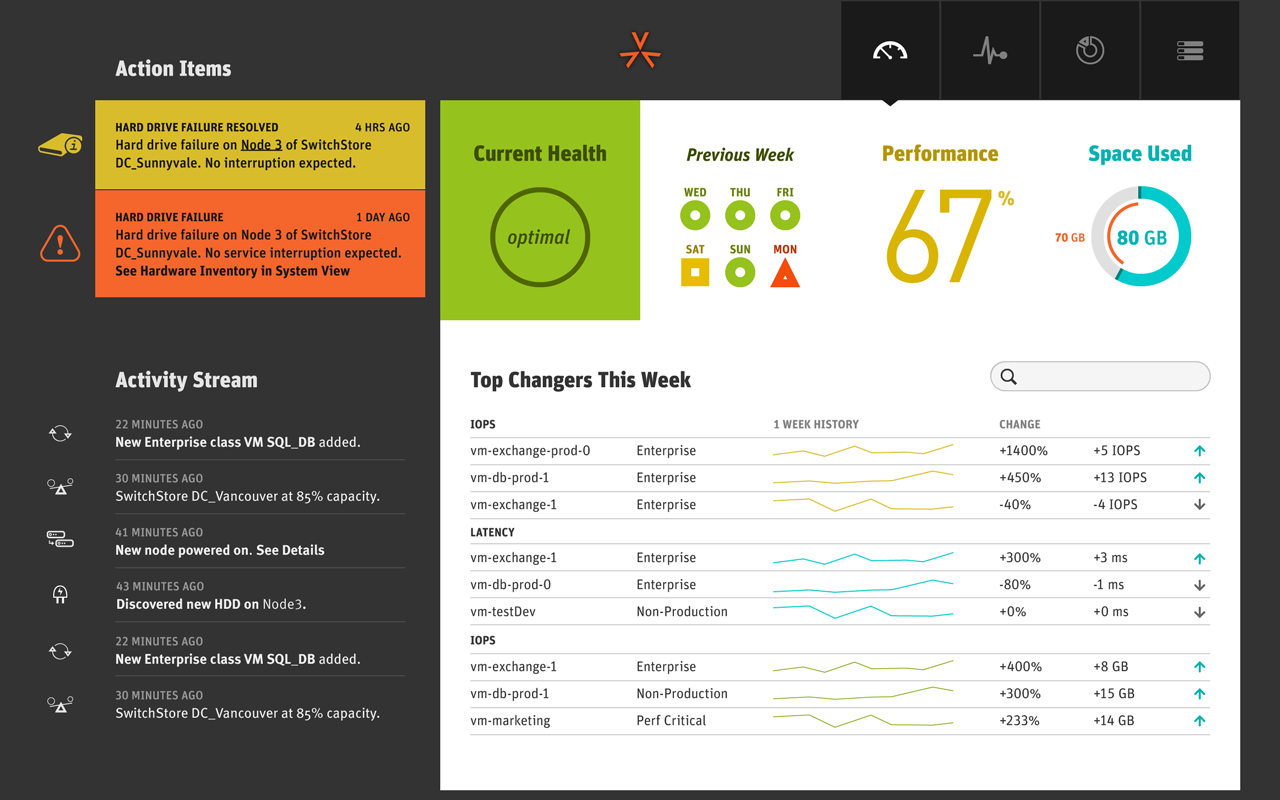
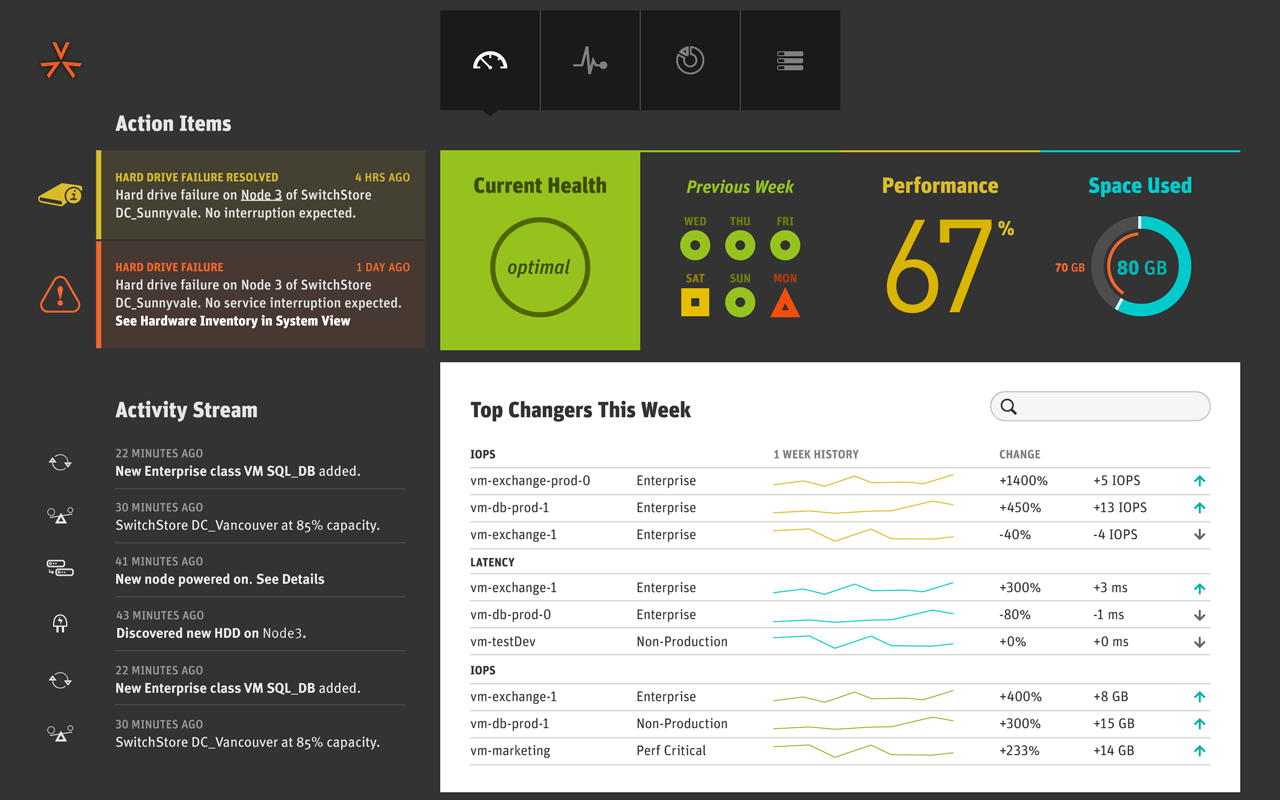
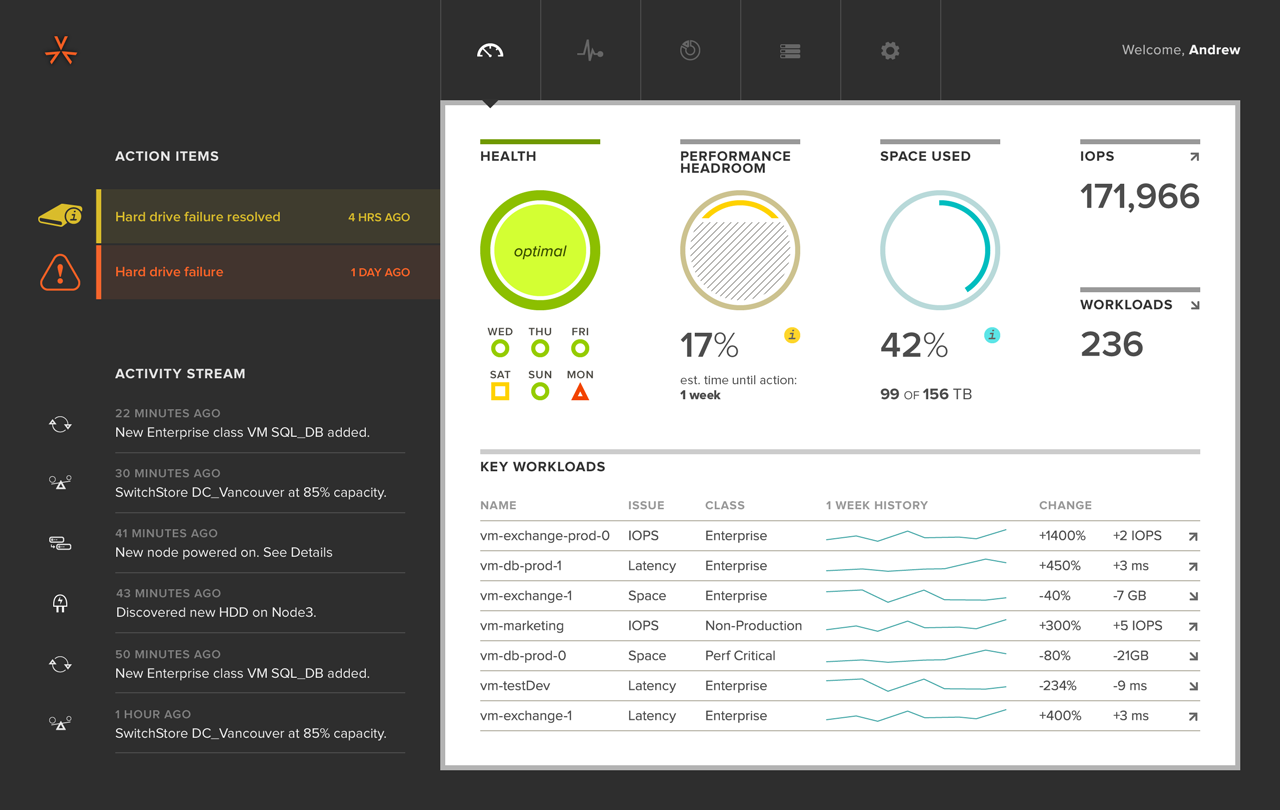
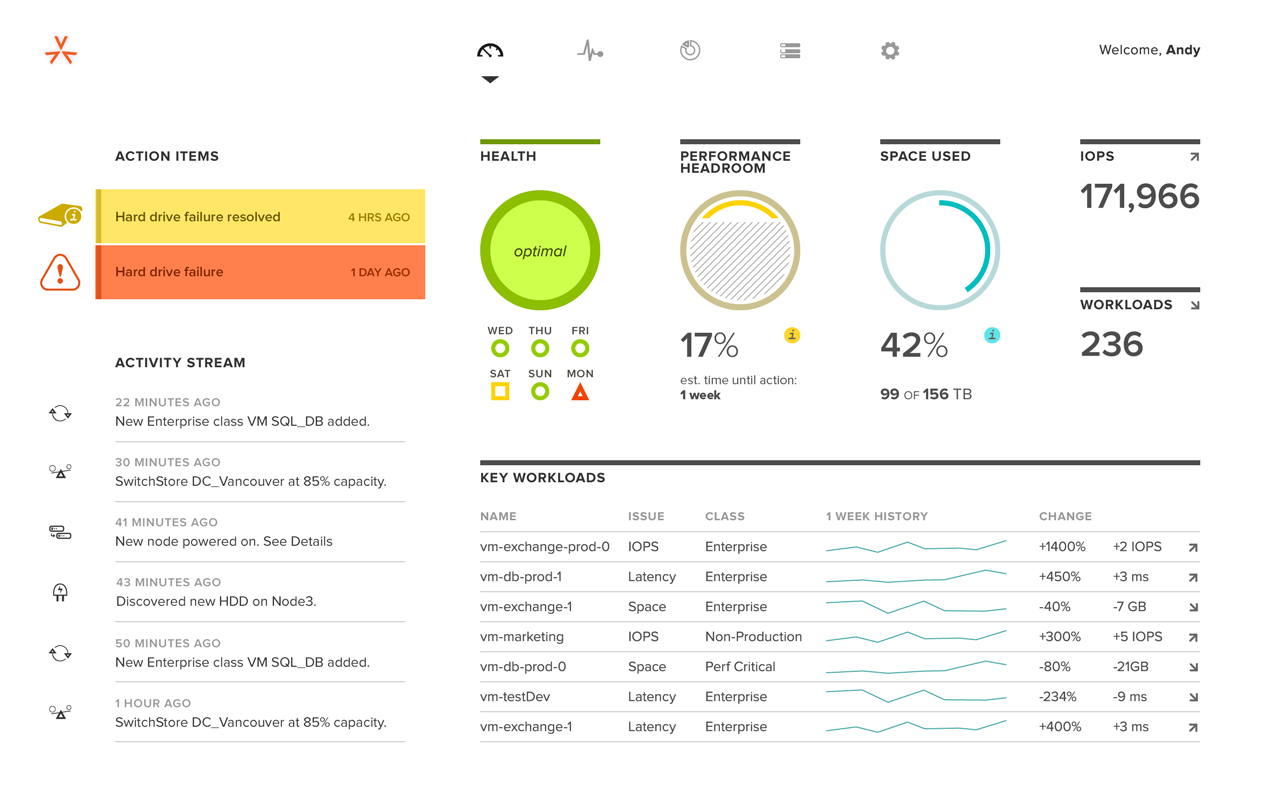
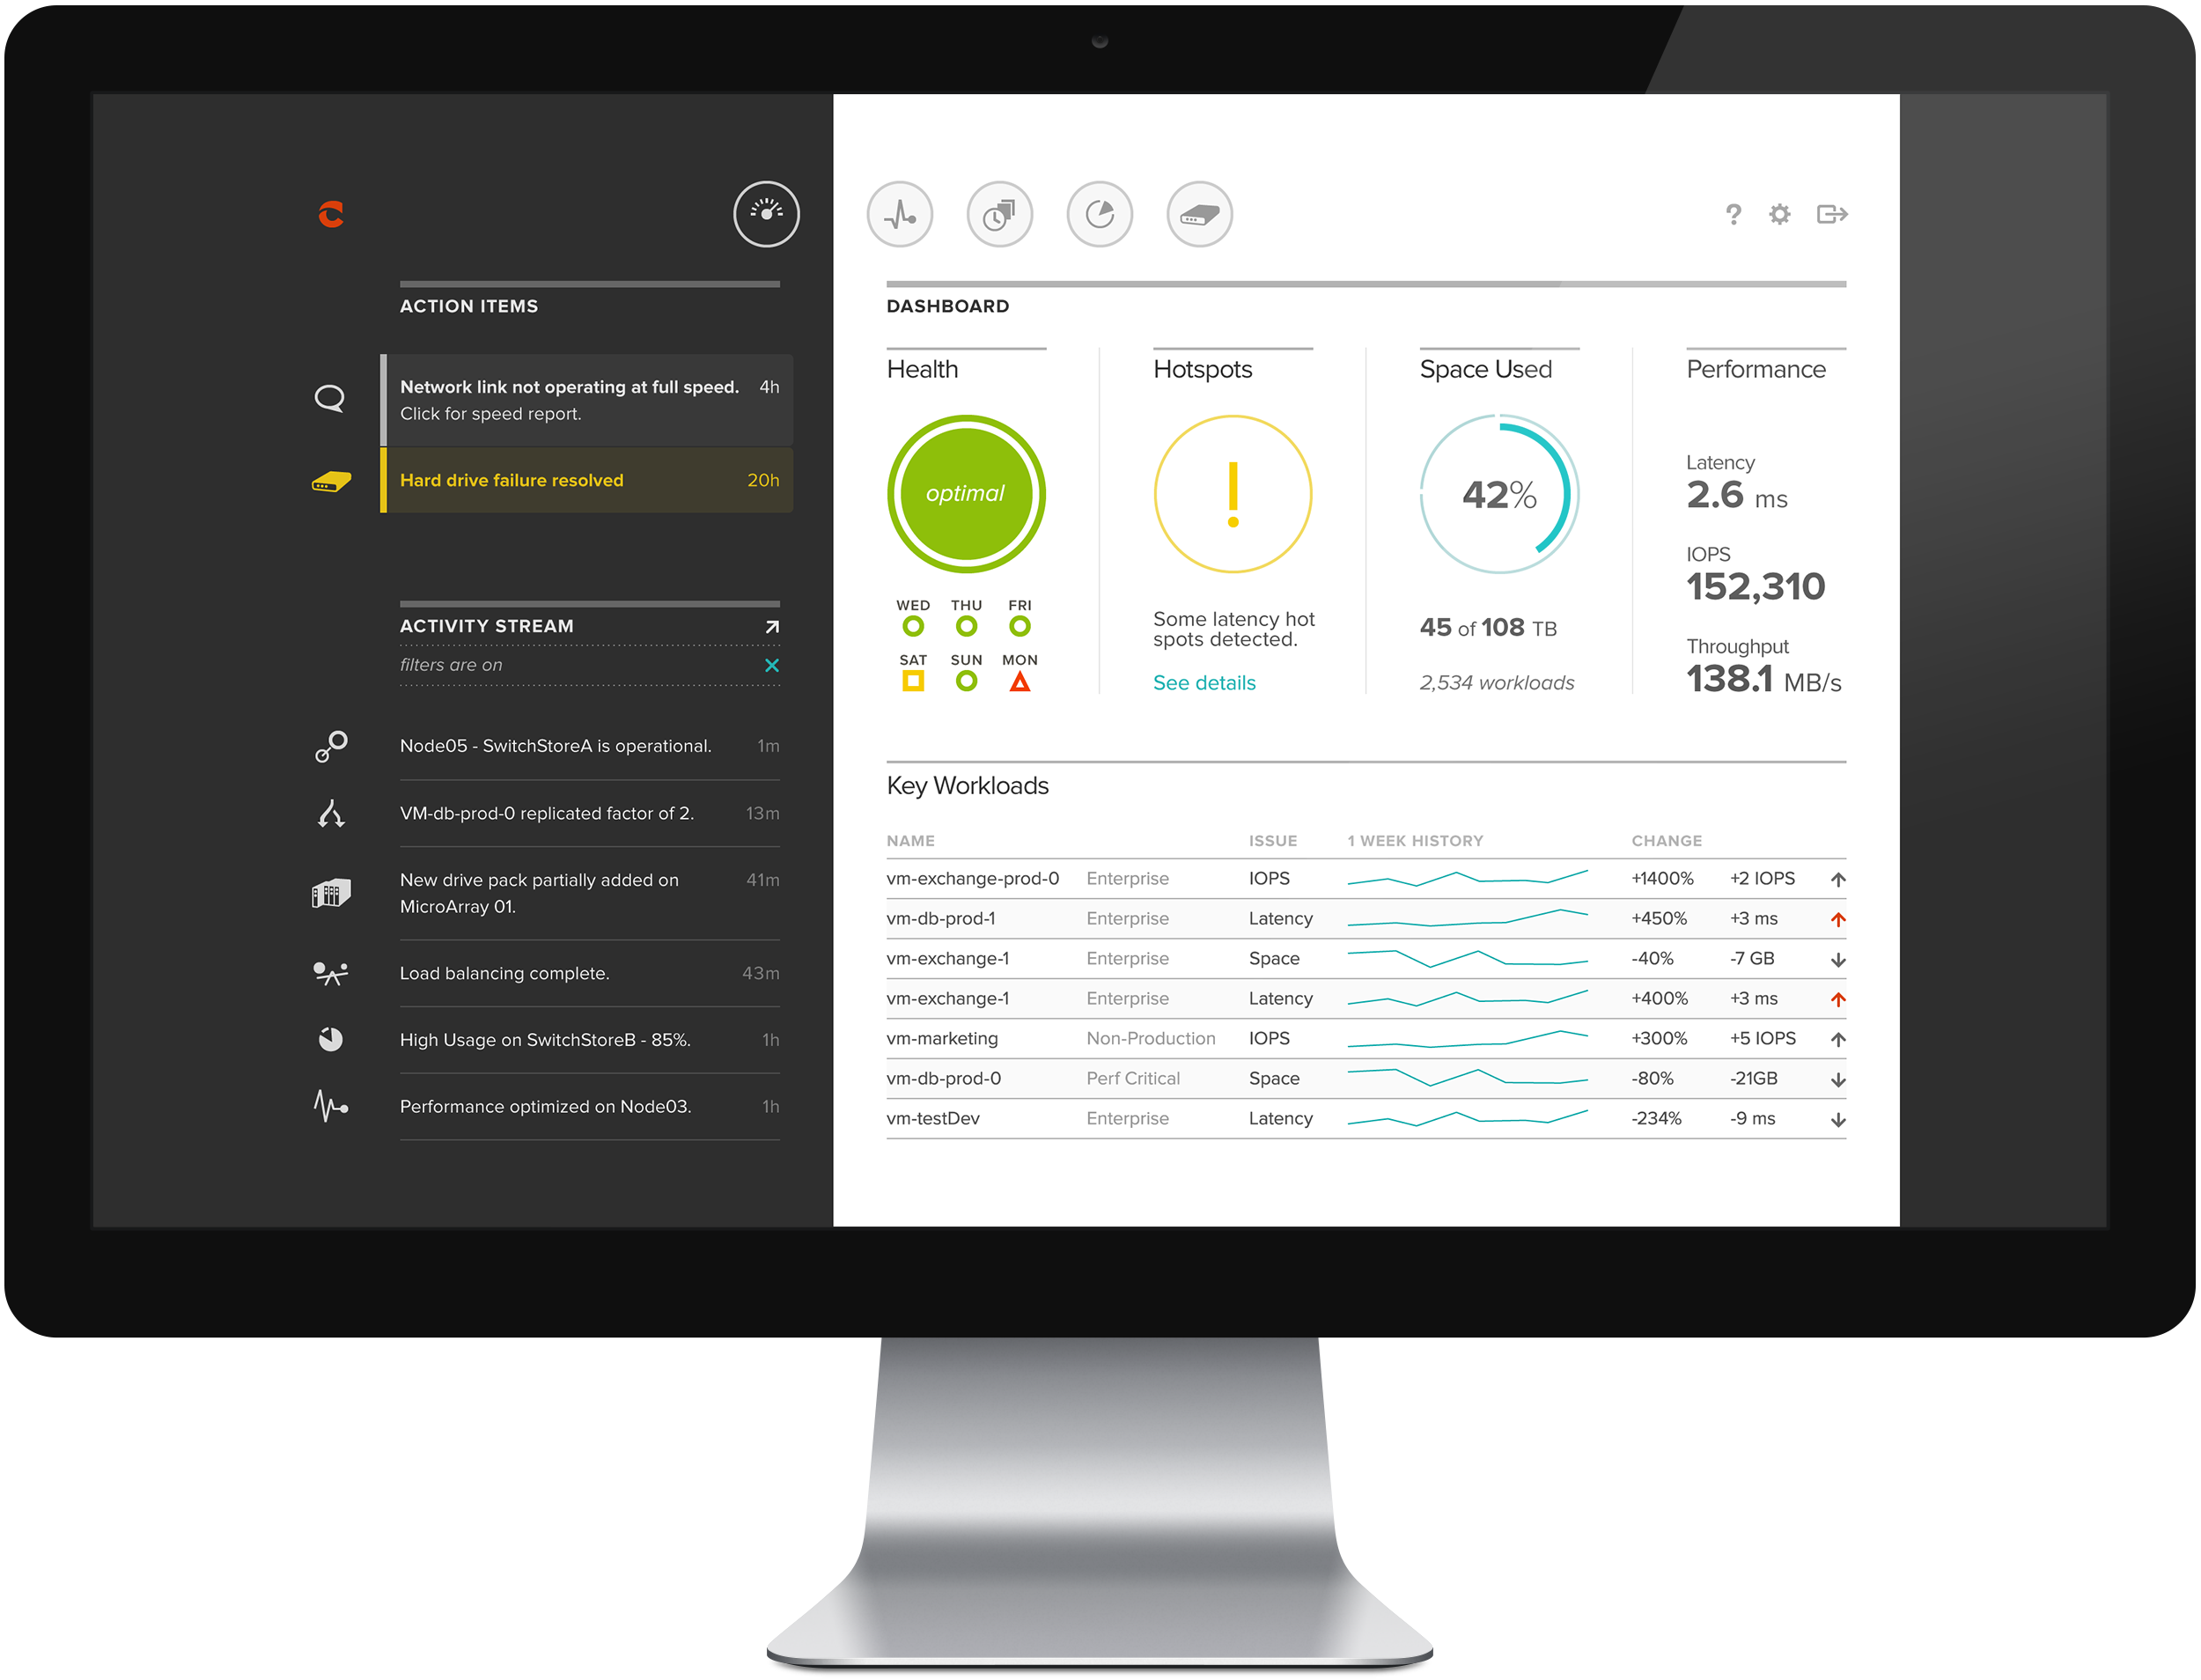
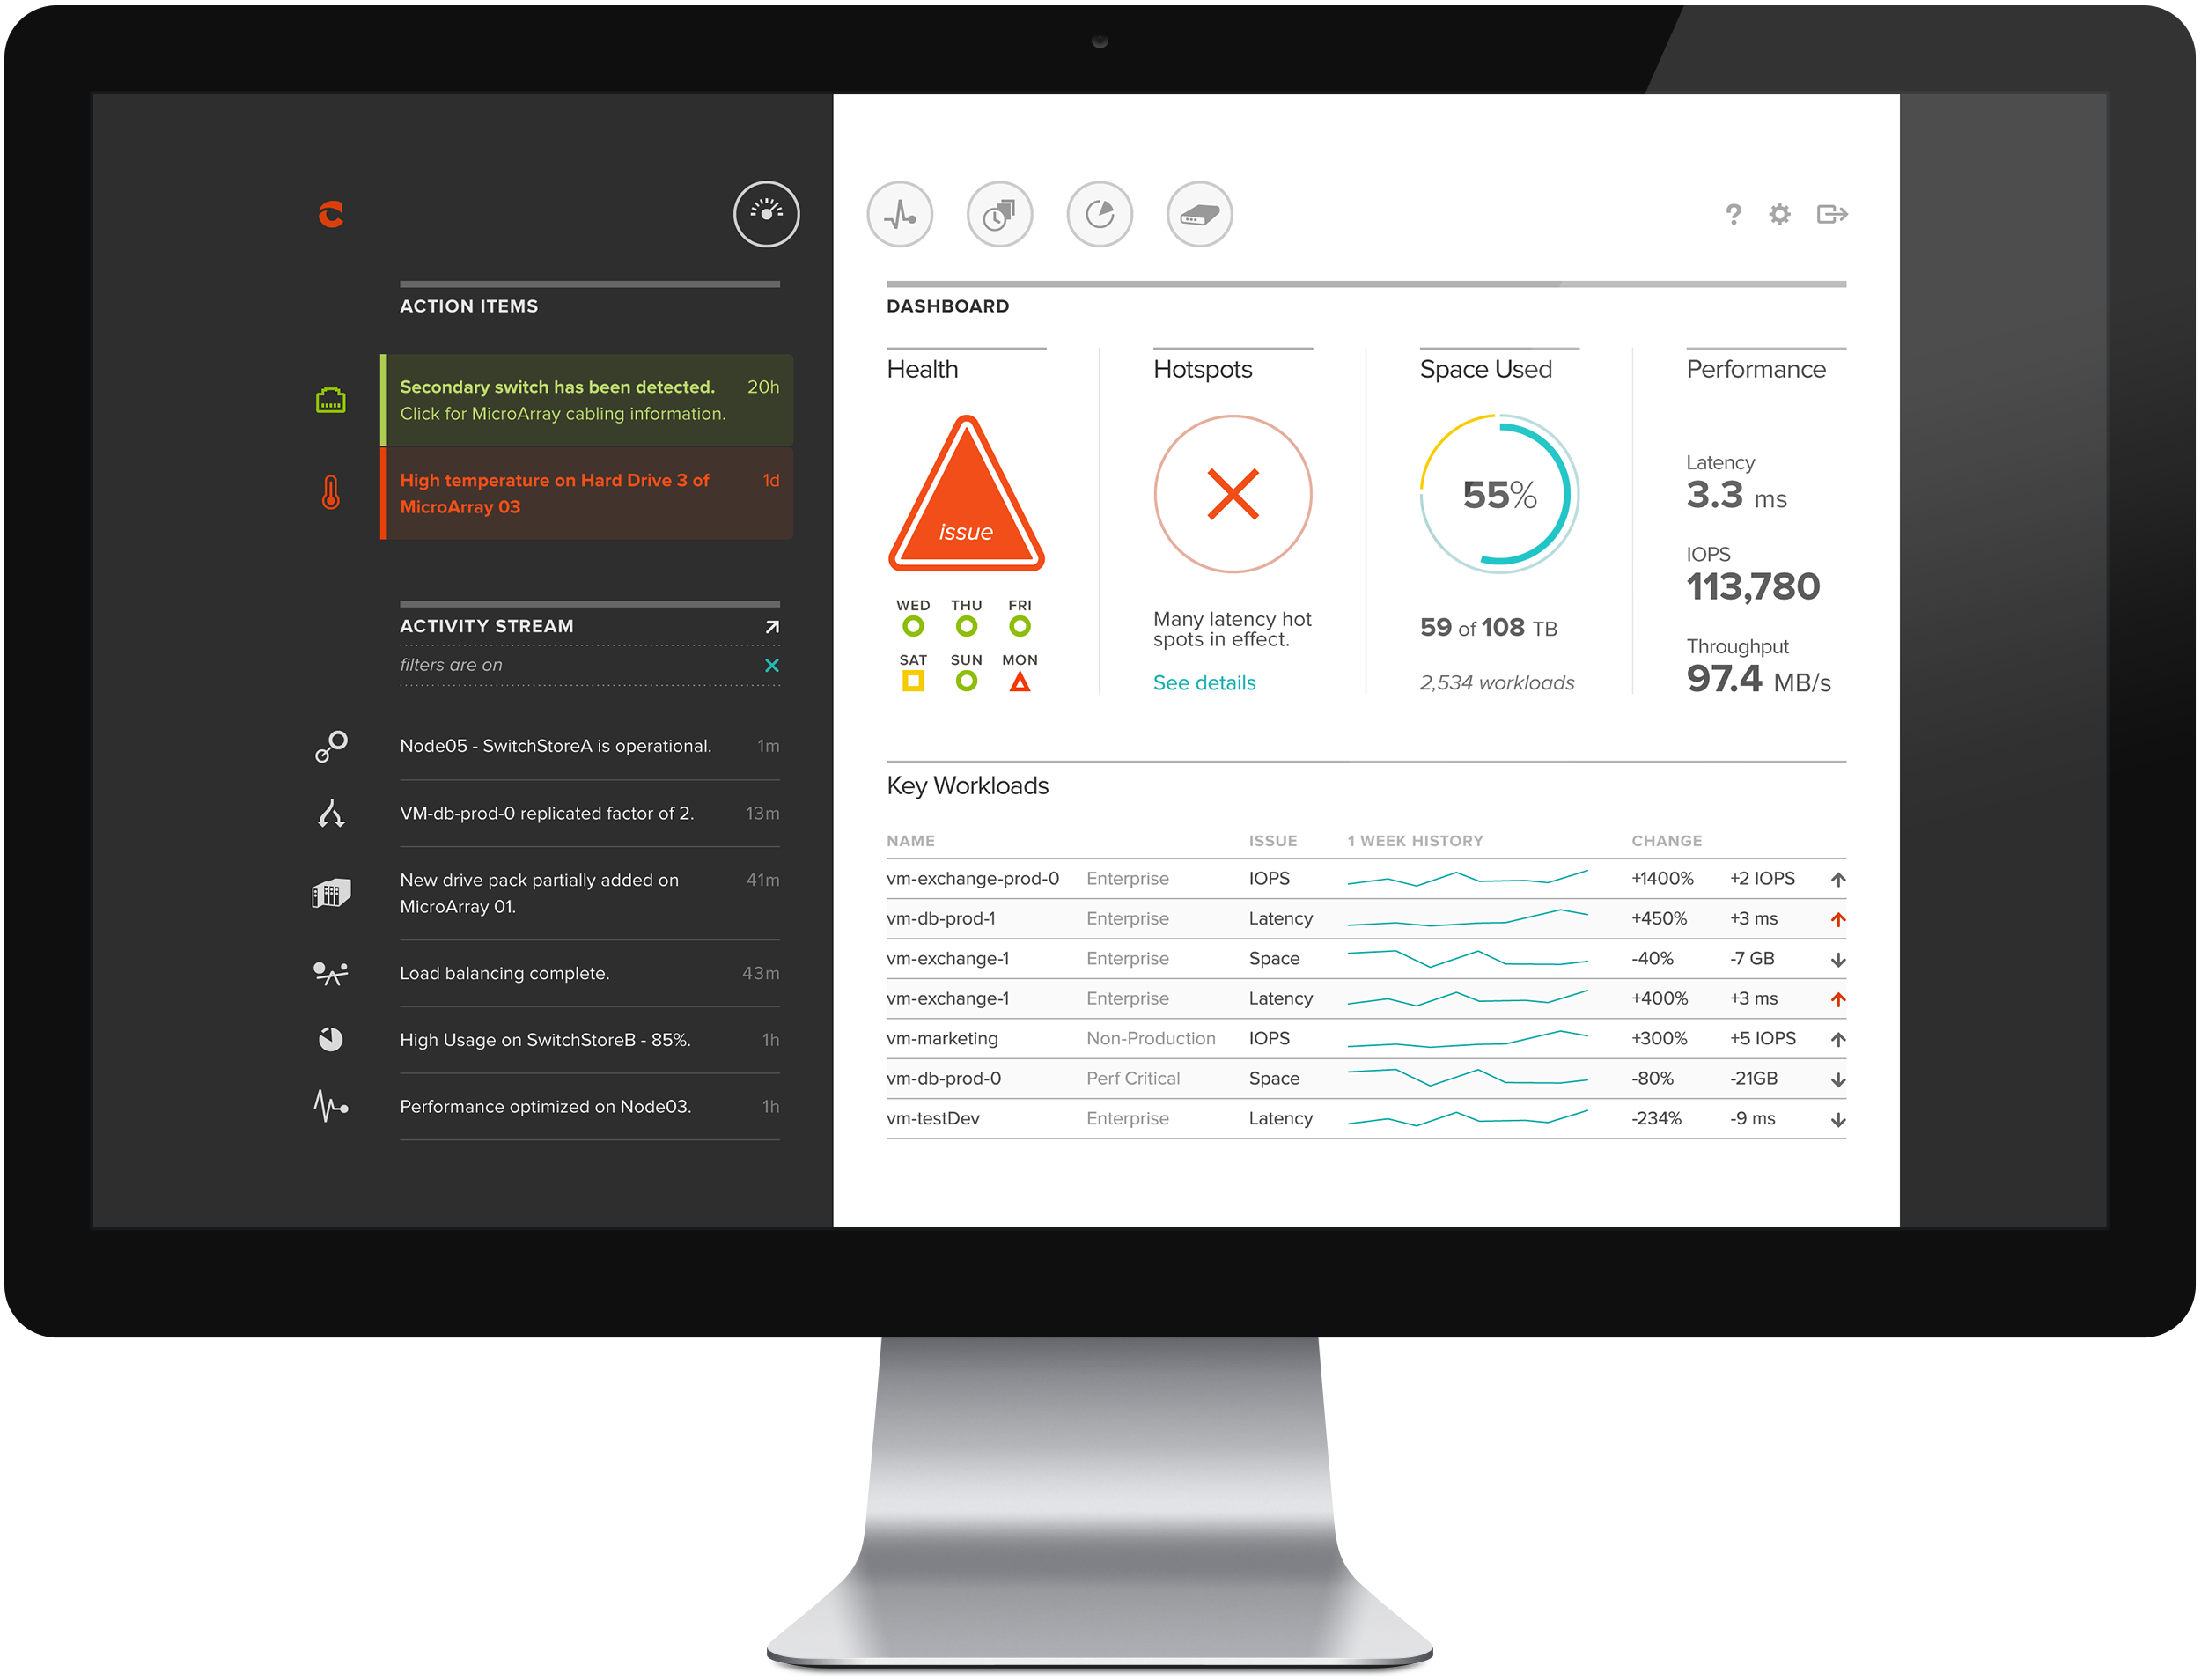
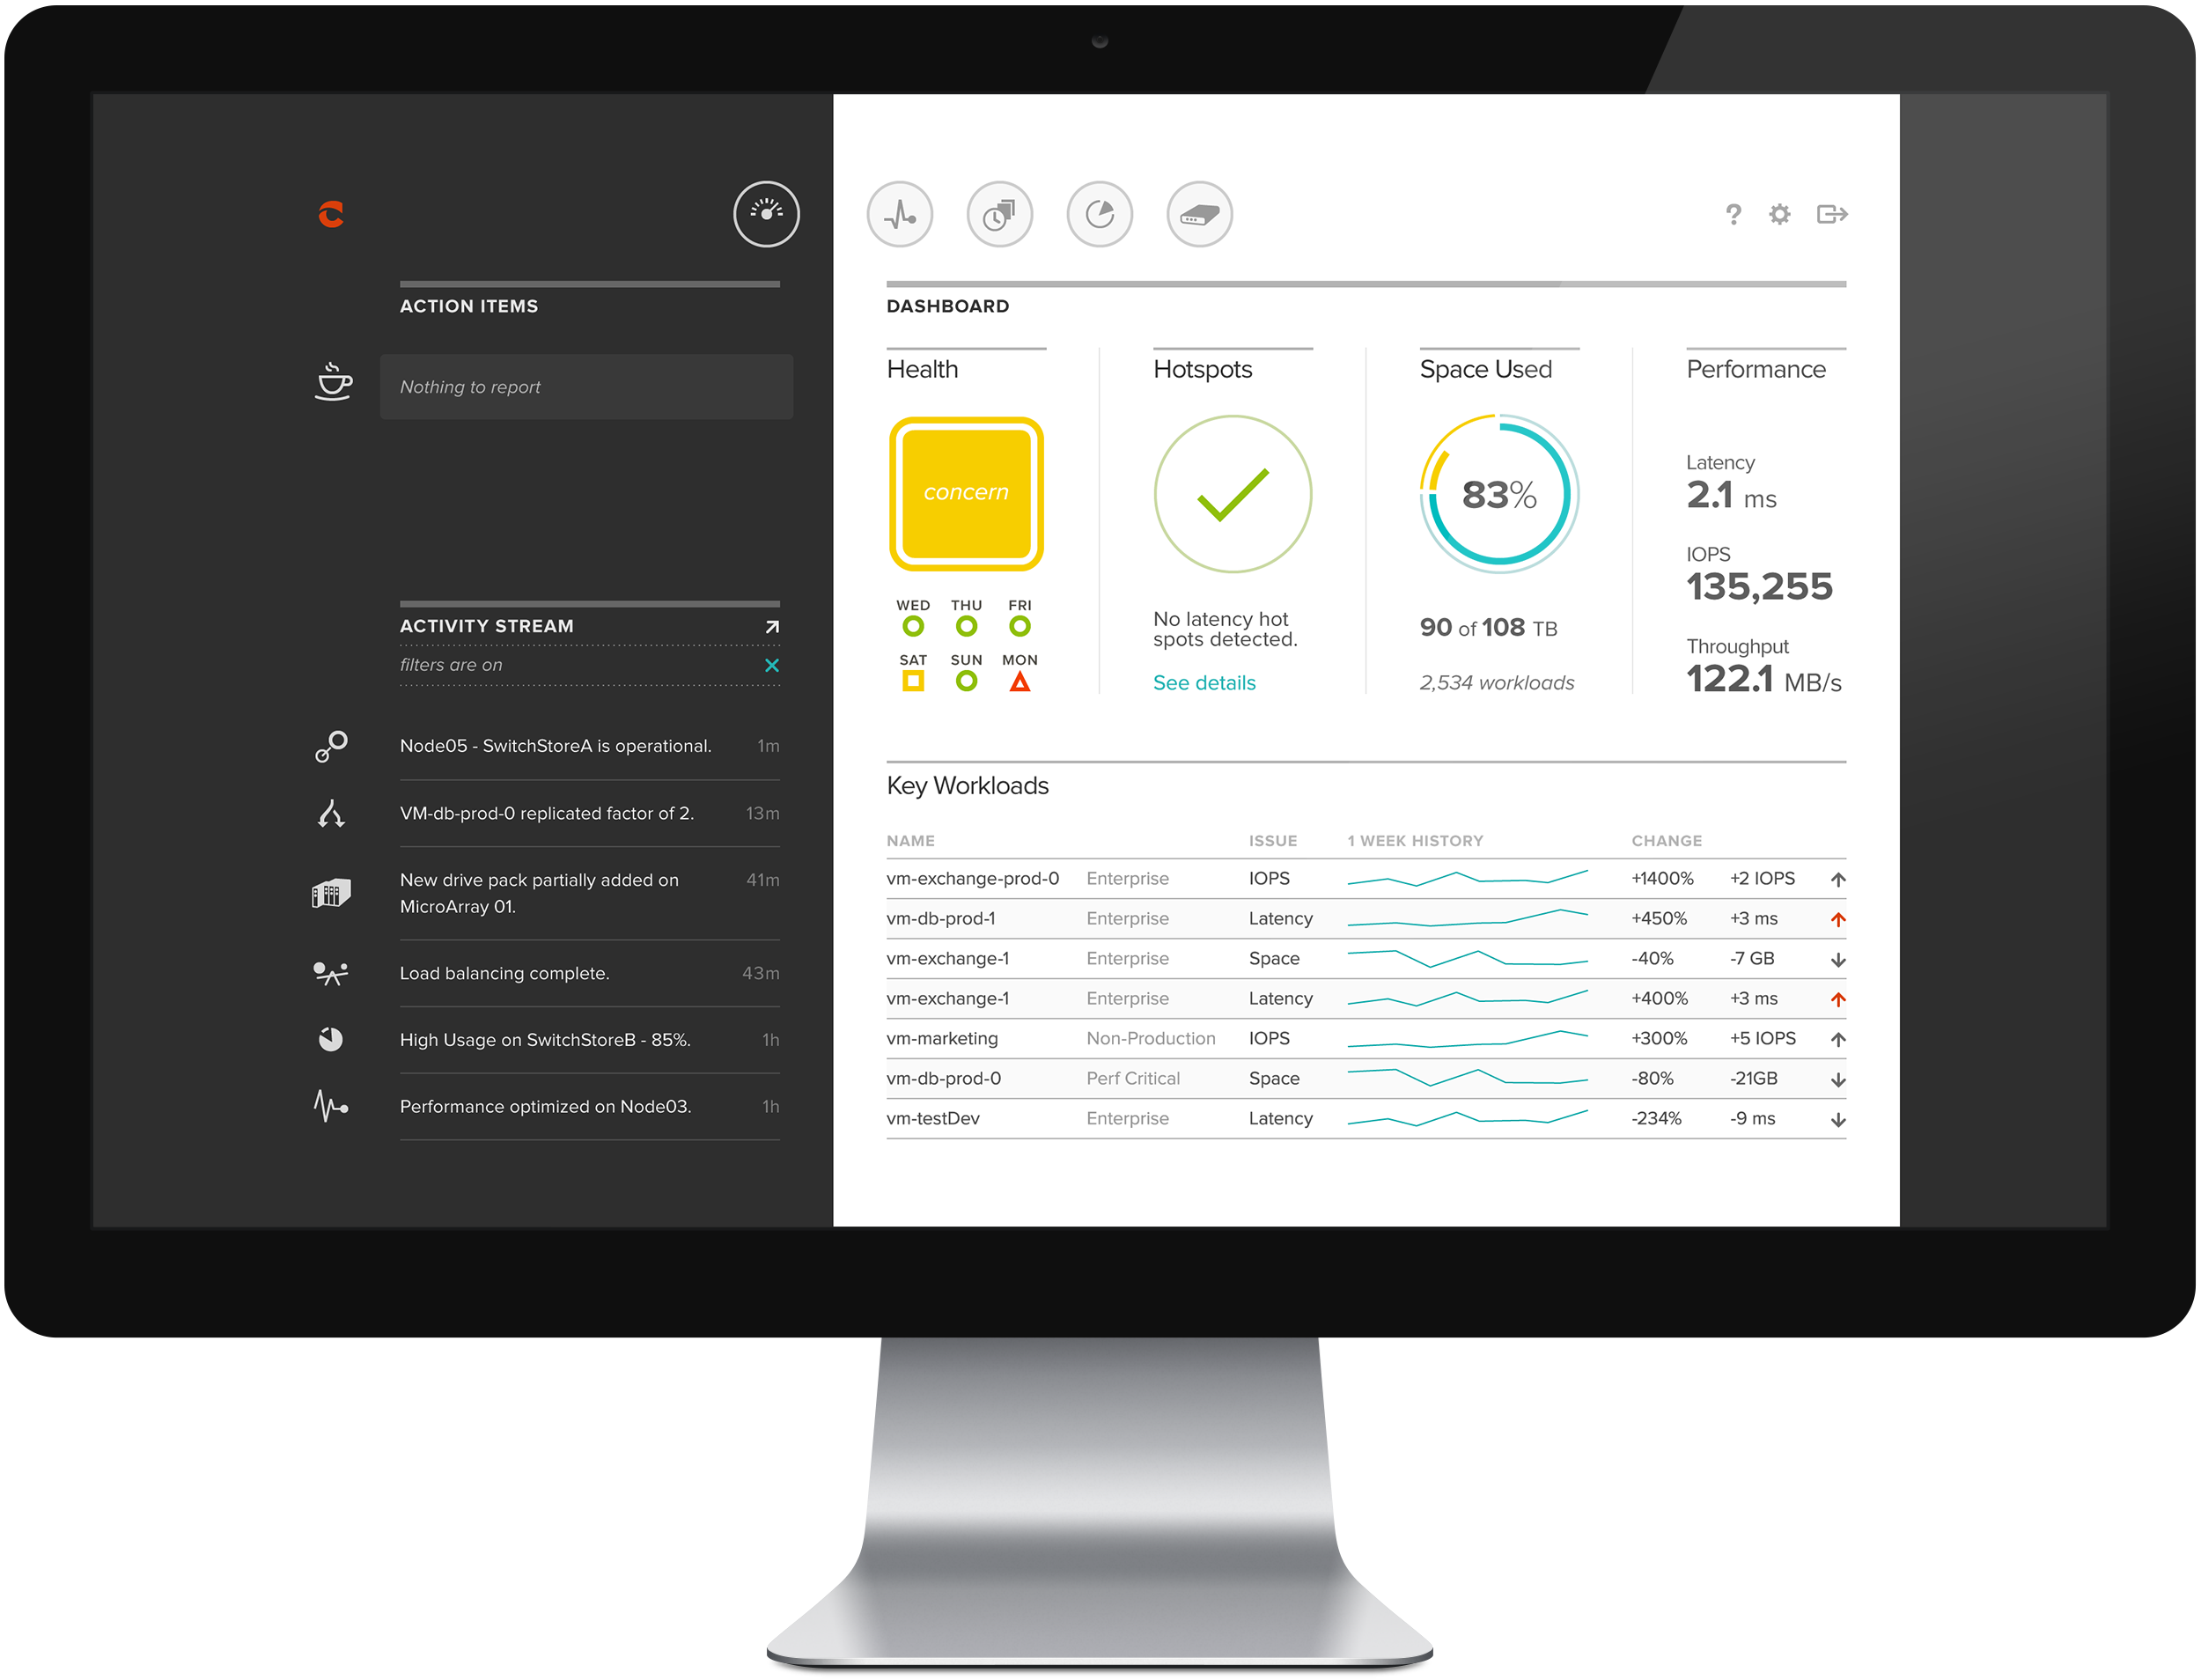
The Dashboard summarizes how the storage is performing at a high level, right now, and ideally communicates: “hands off, don’t worry about the small stuff, but do keep an eye on this.” On a good day, this is as deep as the user should need to go.
Video — various states of the Dashboard’s status area
Colour coding and large graphics communicate clearly. Any major problems are made obvious immediately, and users can focus in on the root cause (e.g. the virtual machines responsible) quickly.
Video — data reduction drill-down
As an example of a drill-down feature, a later iteration of the Dashboard allowed customers to break down the tiers of their data reduction performance.
Purring along
Notification streams
The Action and Activity streams are displayed by default on all of the UI’s screens (when viewport size permits), and for the most part they notify the customer on what the system is doing automatically for them. Action items, a unique set of “live” issues, are the highest priority, and occasionally require user involvement.
Pop the lid
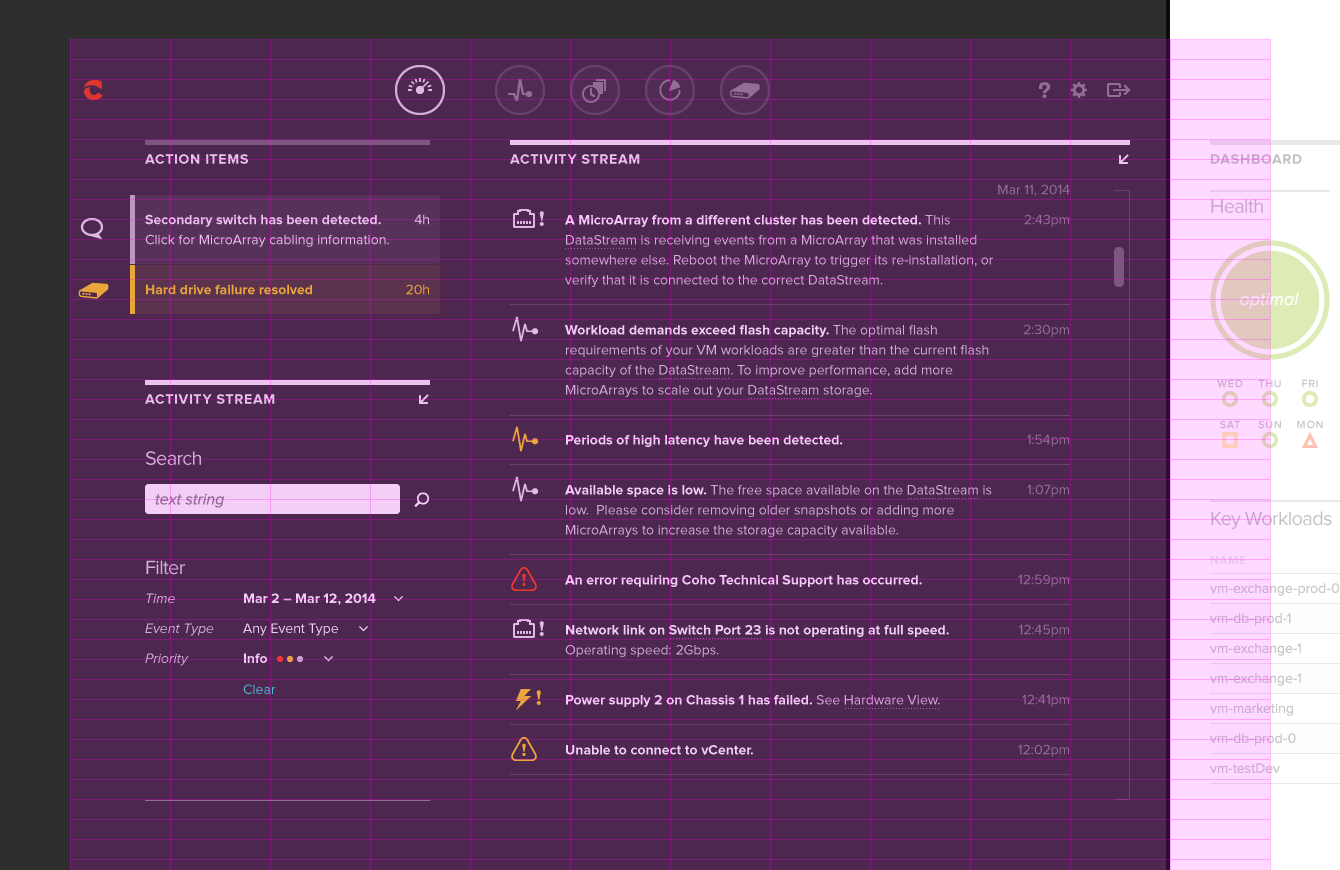
Activity stream detail
The Activity stream provides a complete history of the system. Revealing the power under the hood, customers can expand the stream to view more detail, while search and filter features fine-tune the breadth of the stream.
Video - accessing the expanded activity stream
Get in touch
Tablet layout + Usage screen
While the initial design and build of the app focused solely on large viewports, two years into the project we developed a tablet-specific layout, where the Action and Activity streams were hidden by default.
Video — tablet breakpoint on the Usage screen
The Usage screen highlights one of Coho Data’s strengths — offering modular service-based charging — in contrast to the traditional riskiness of performance estimates and upfront costs. Customers could easily break down usage by department and bill accordingly.
Rack and stack
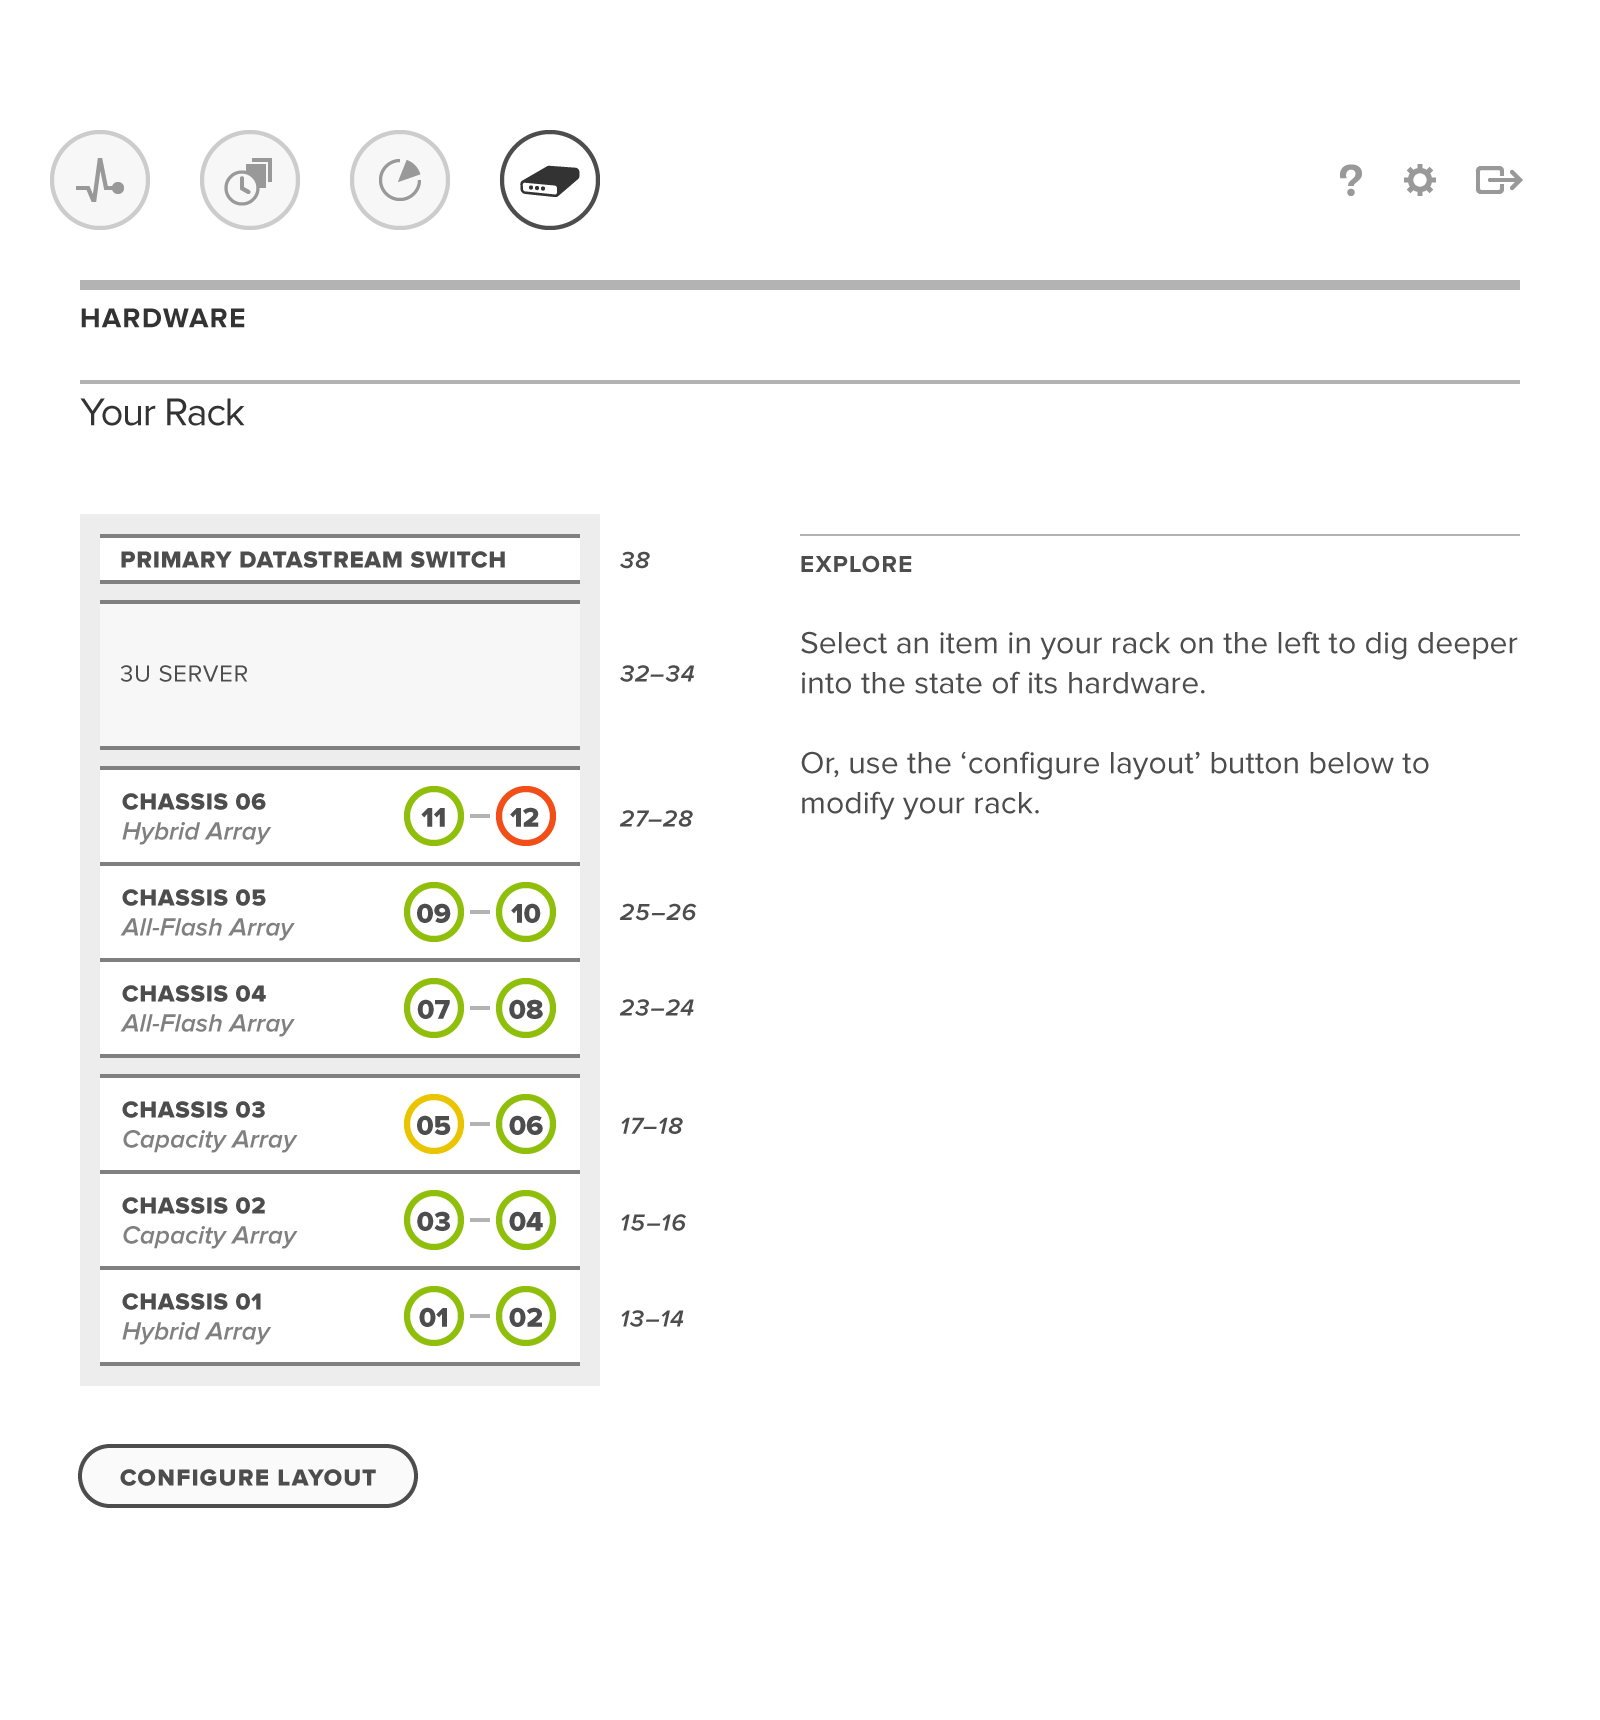
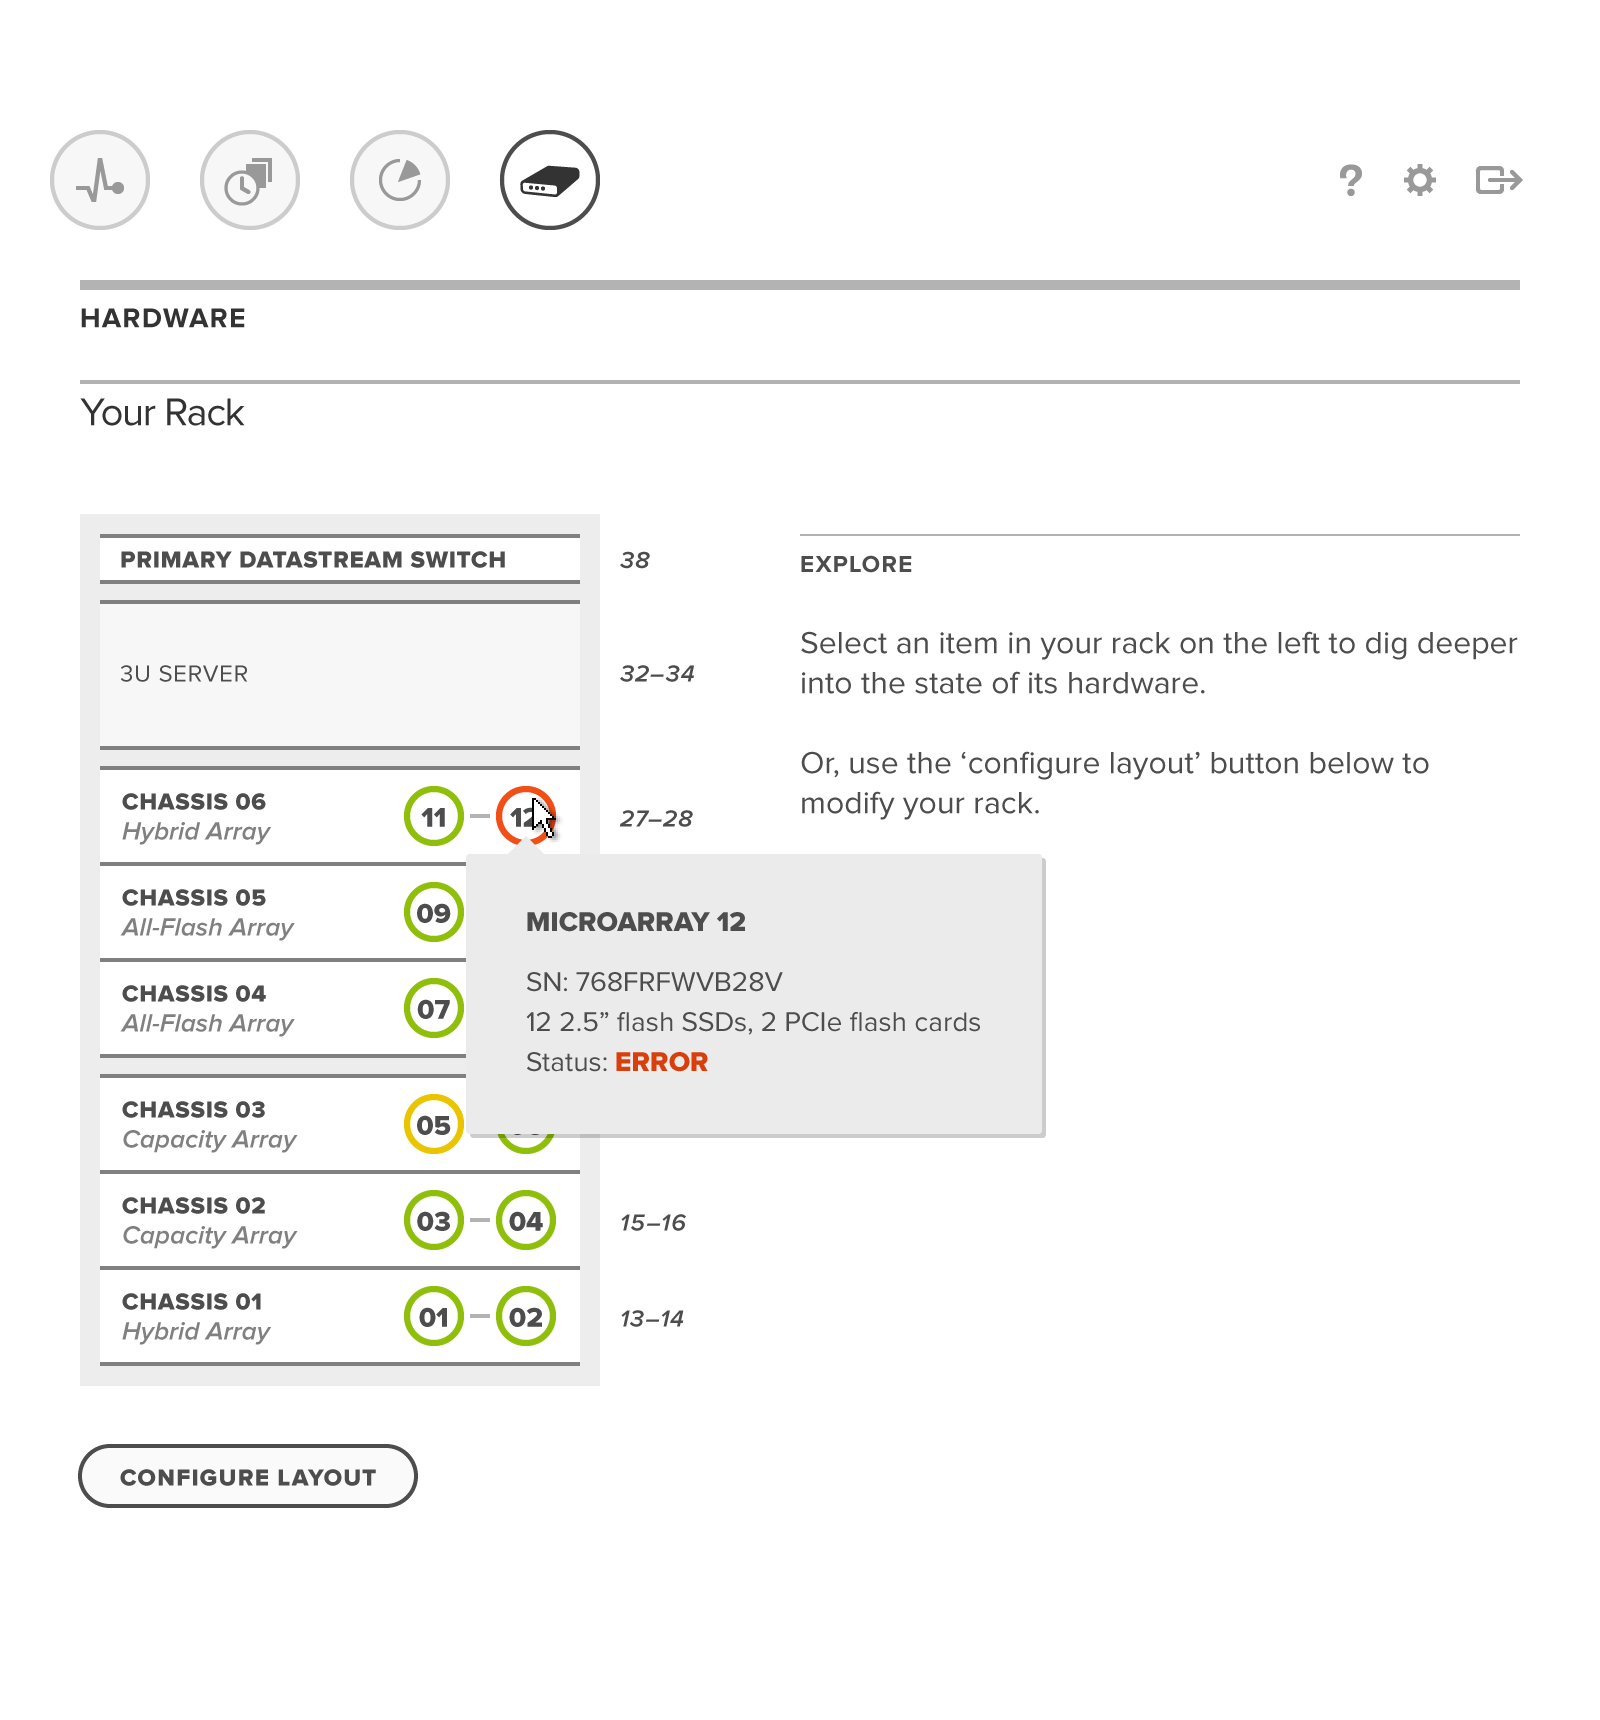
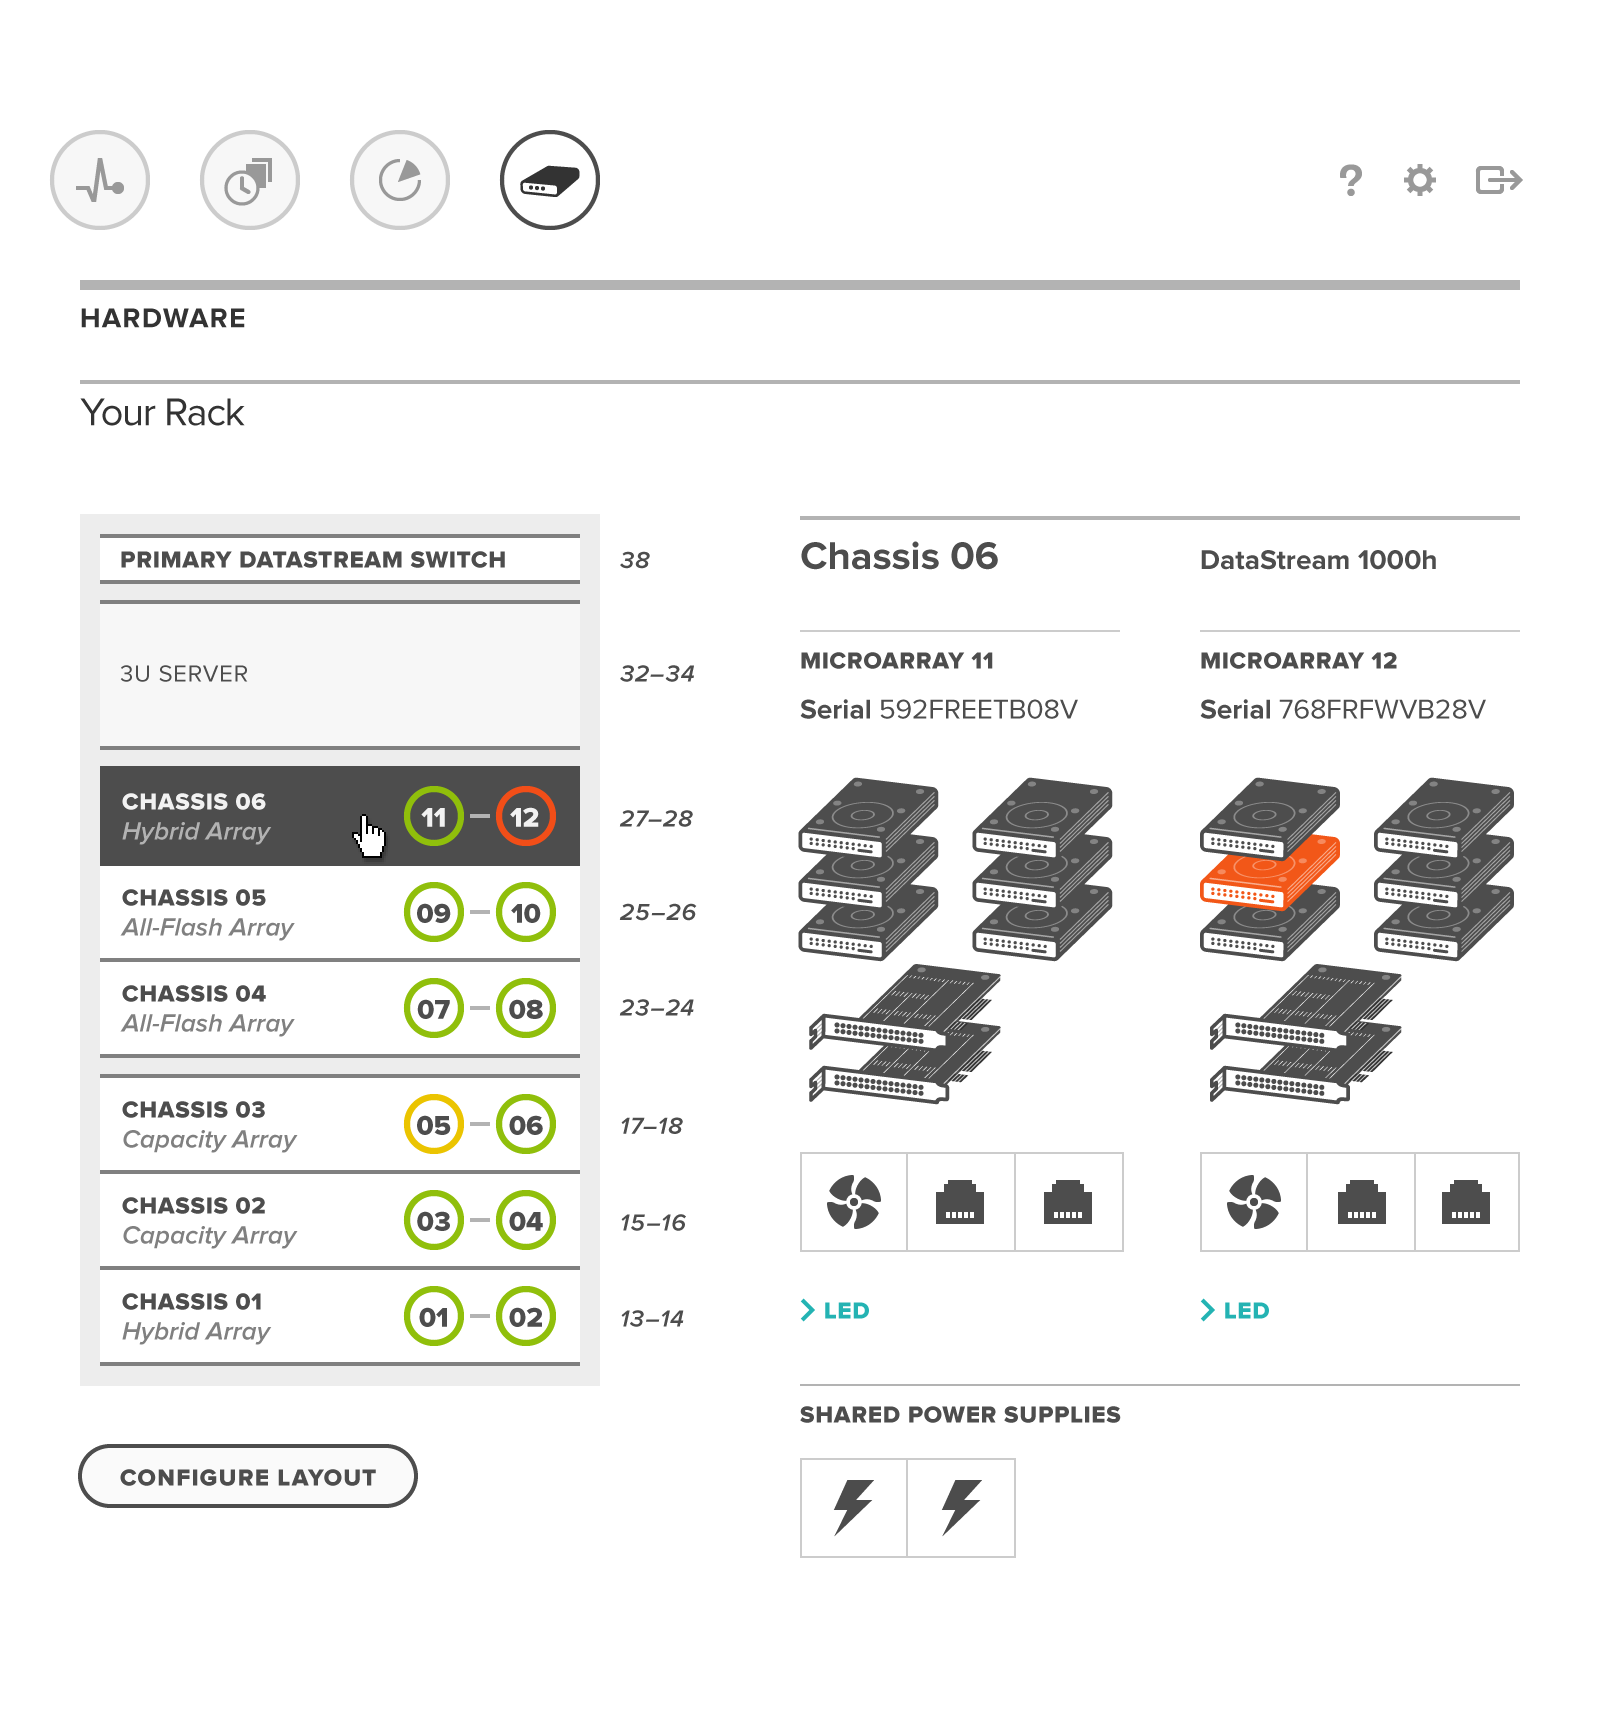
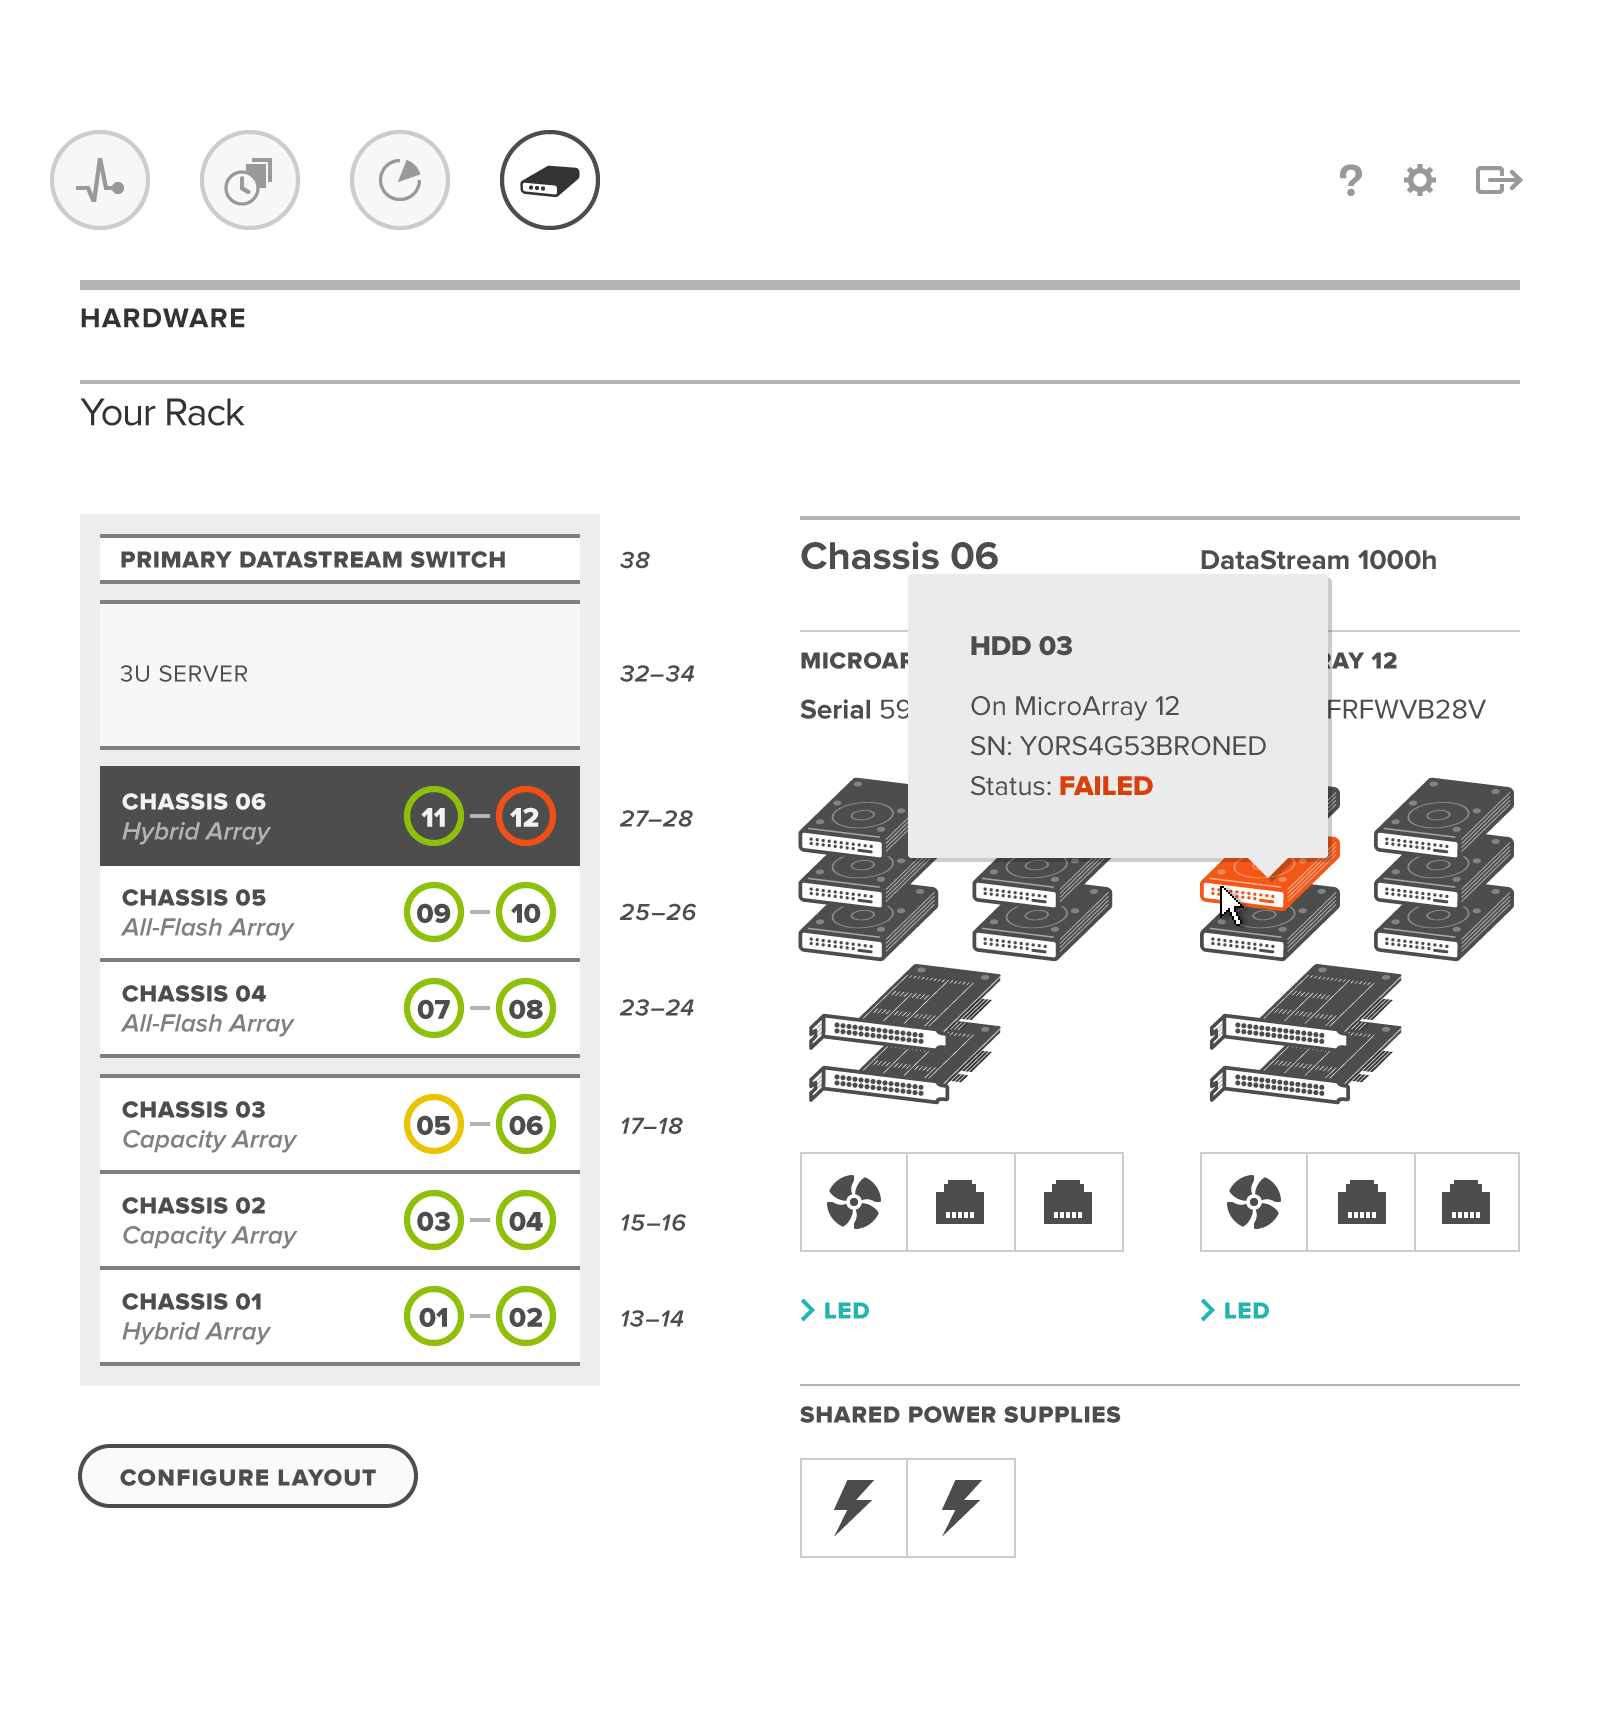
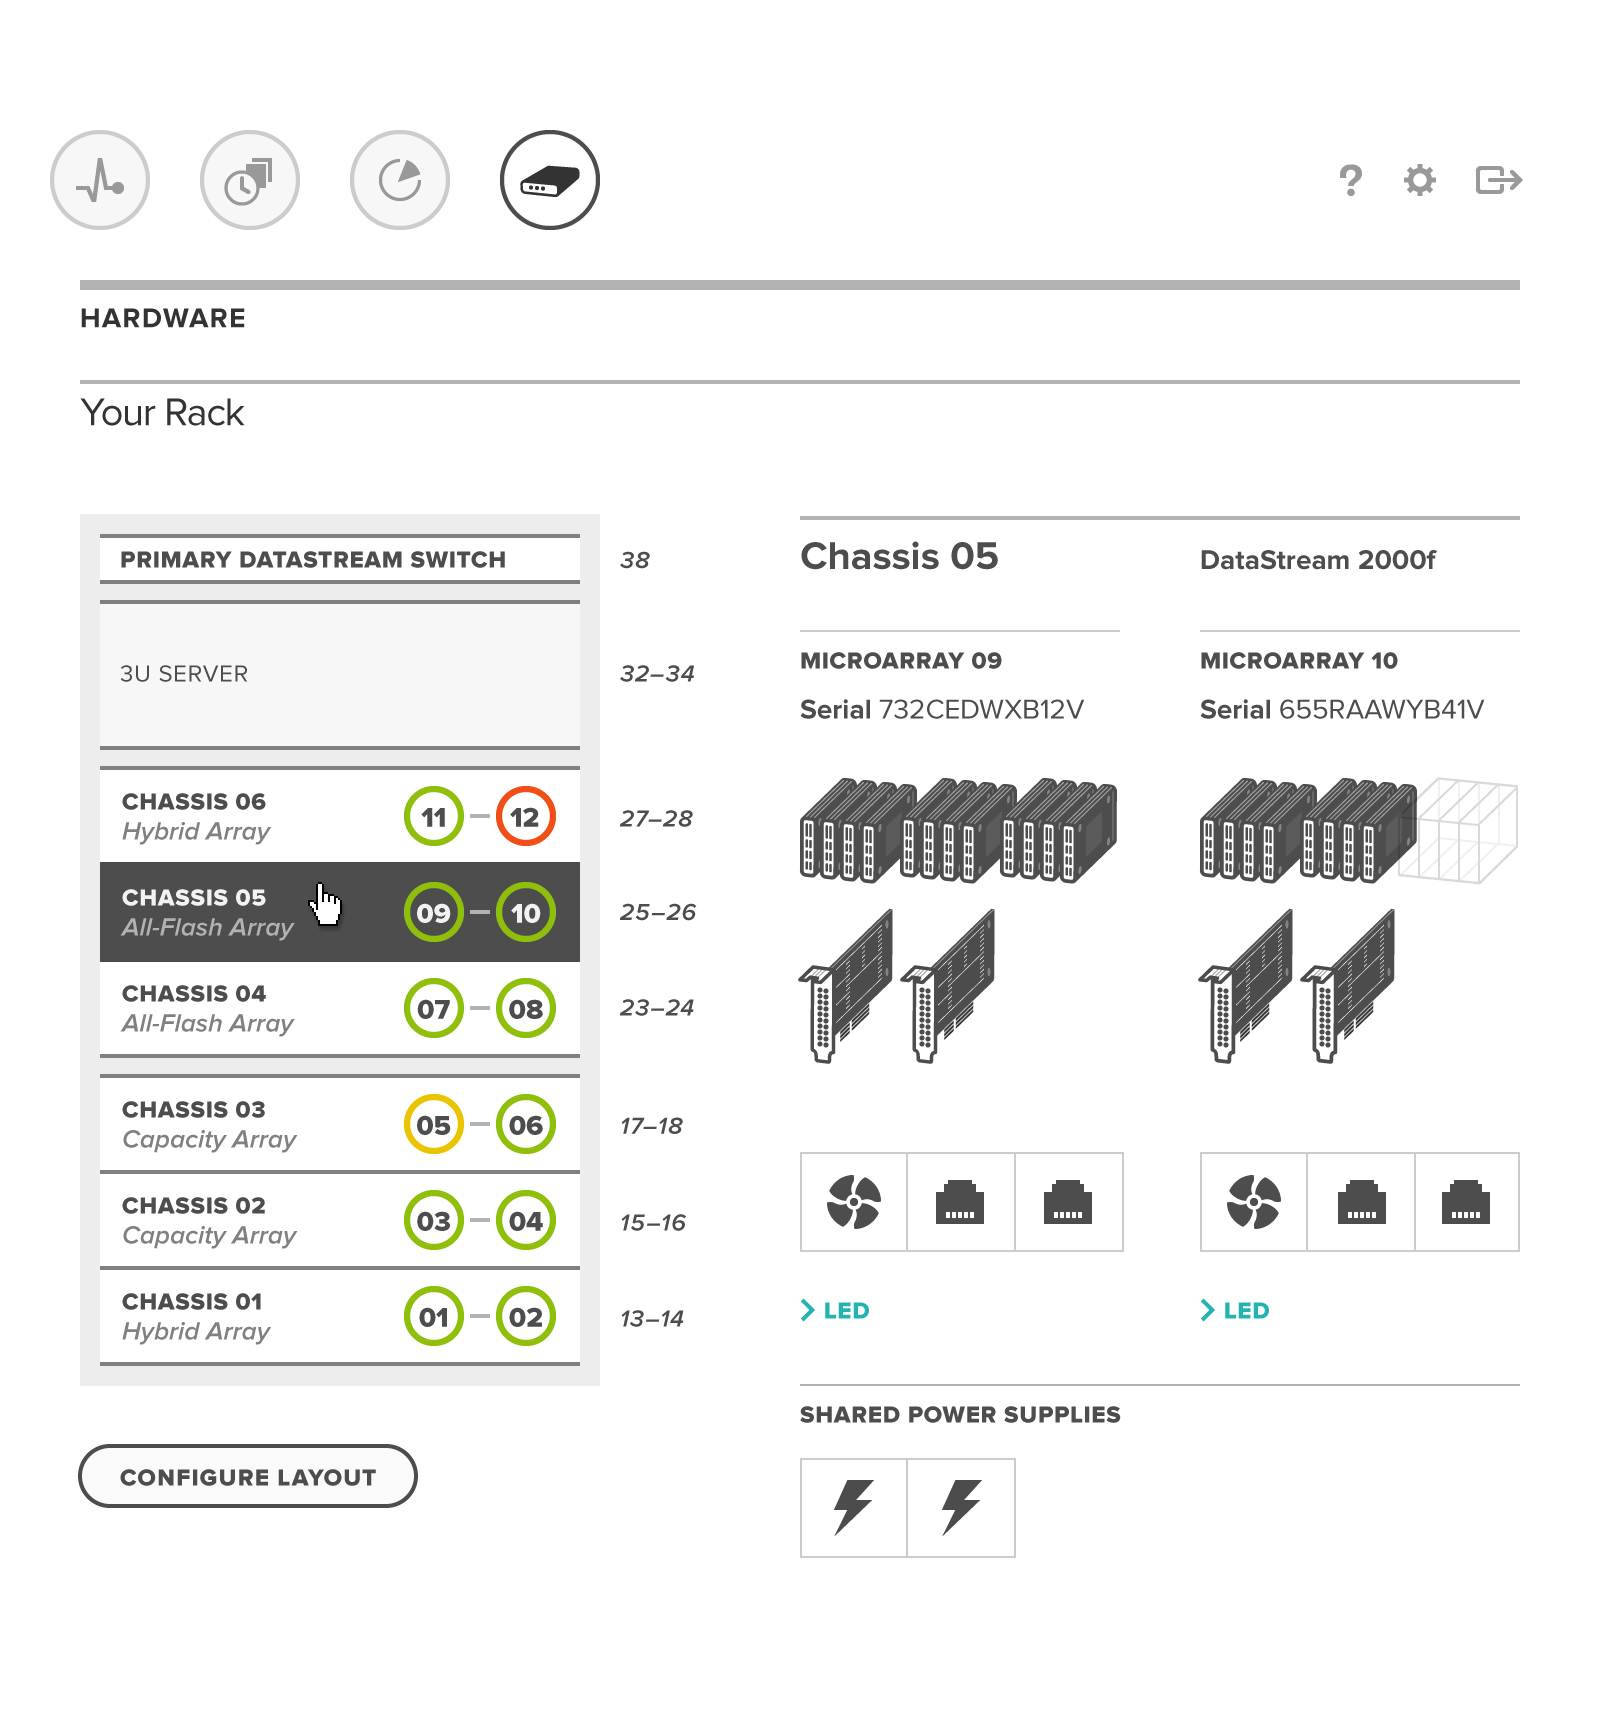
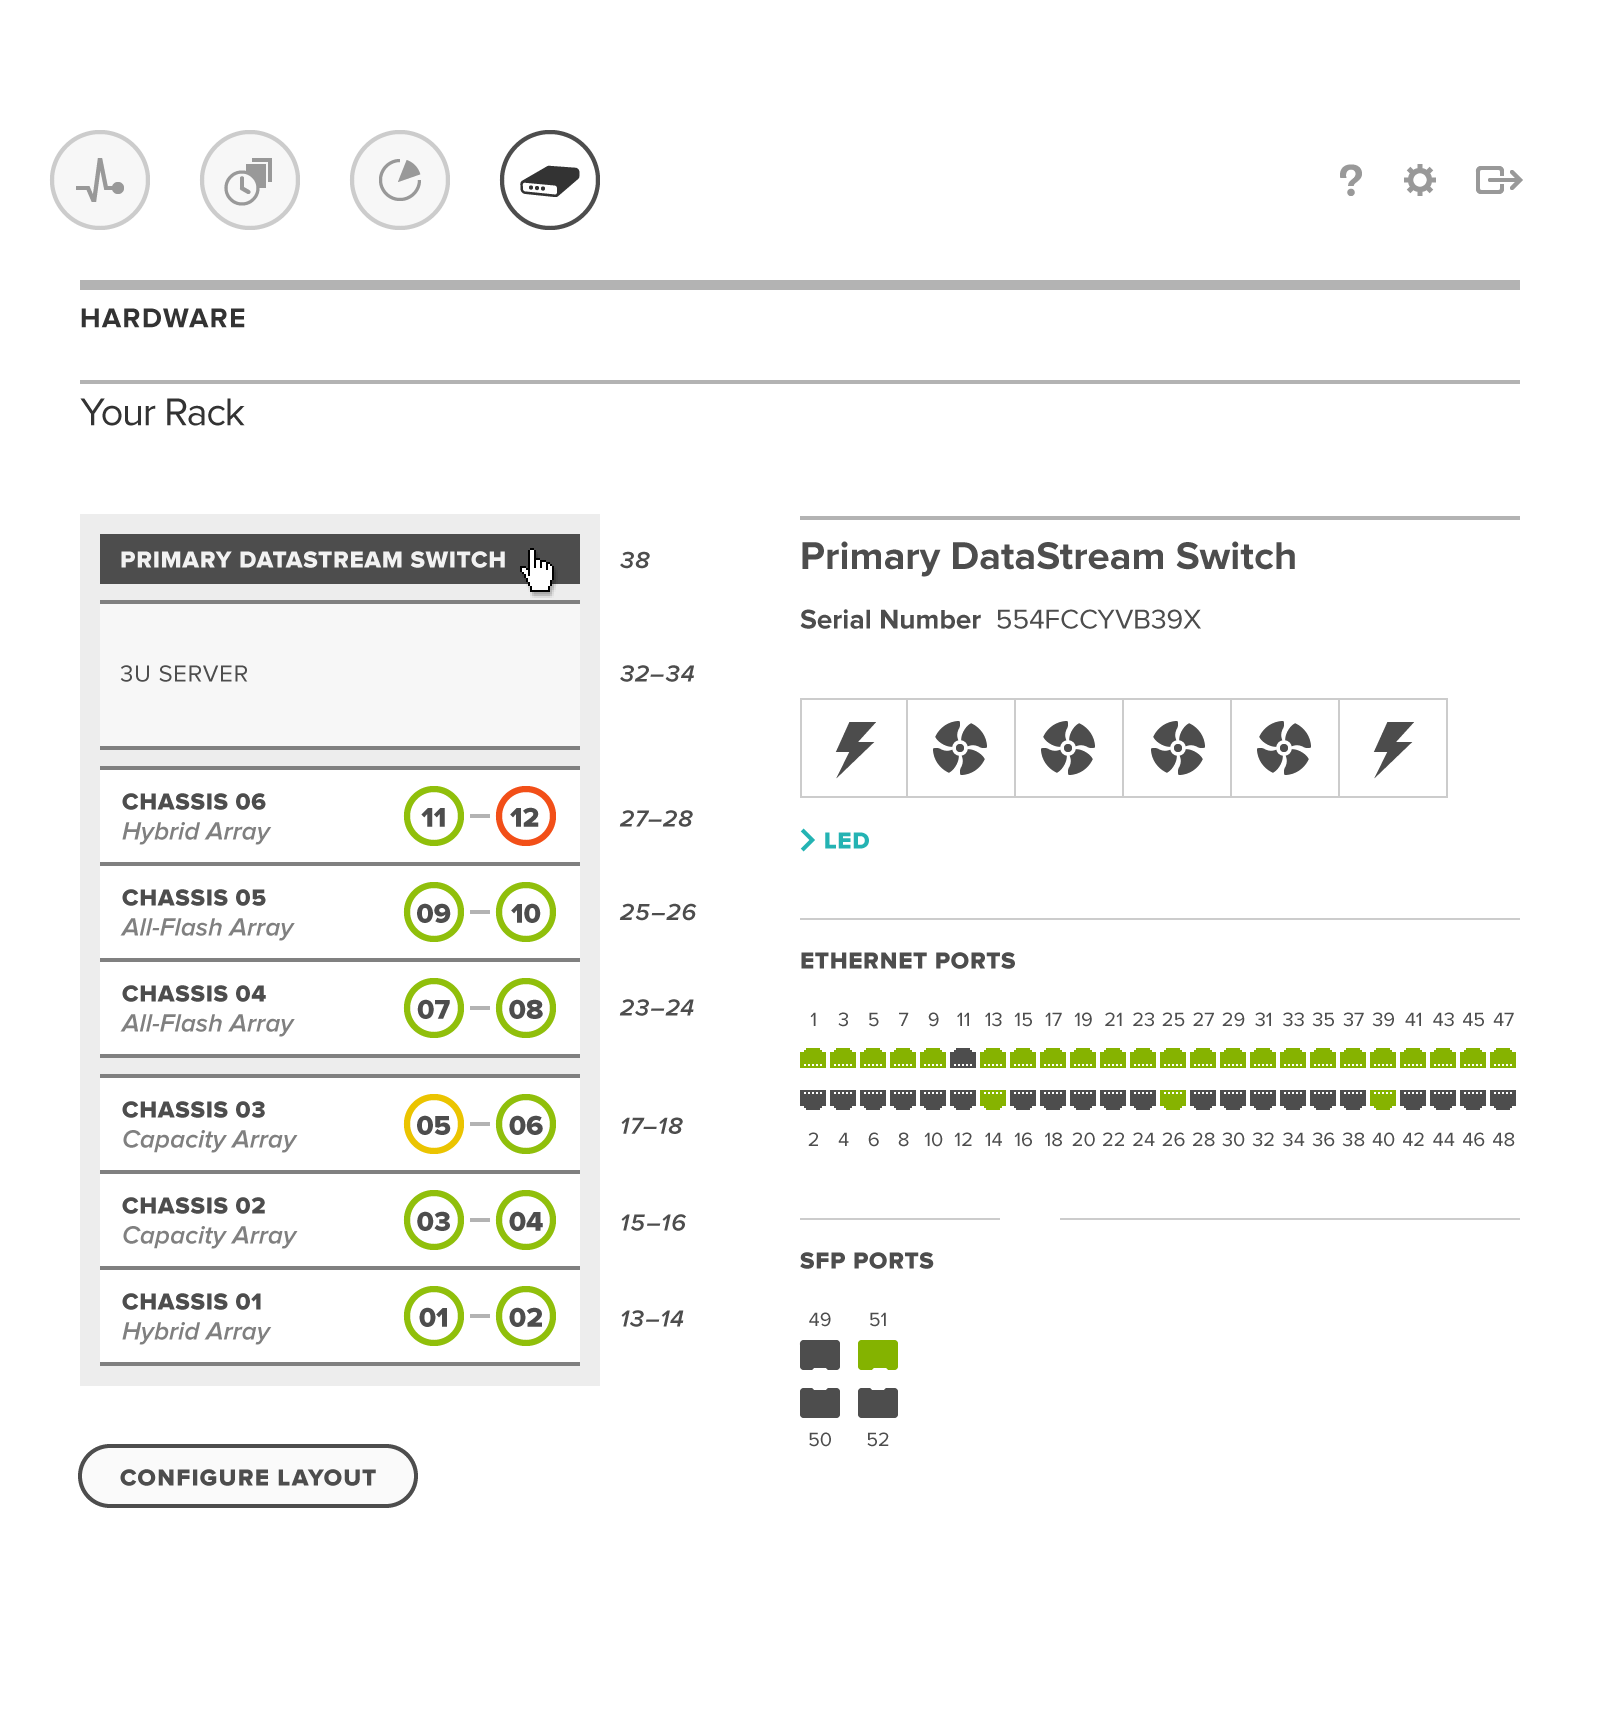
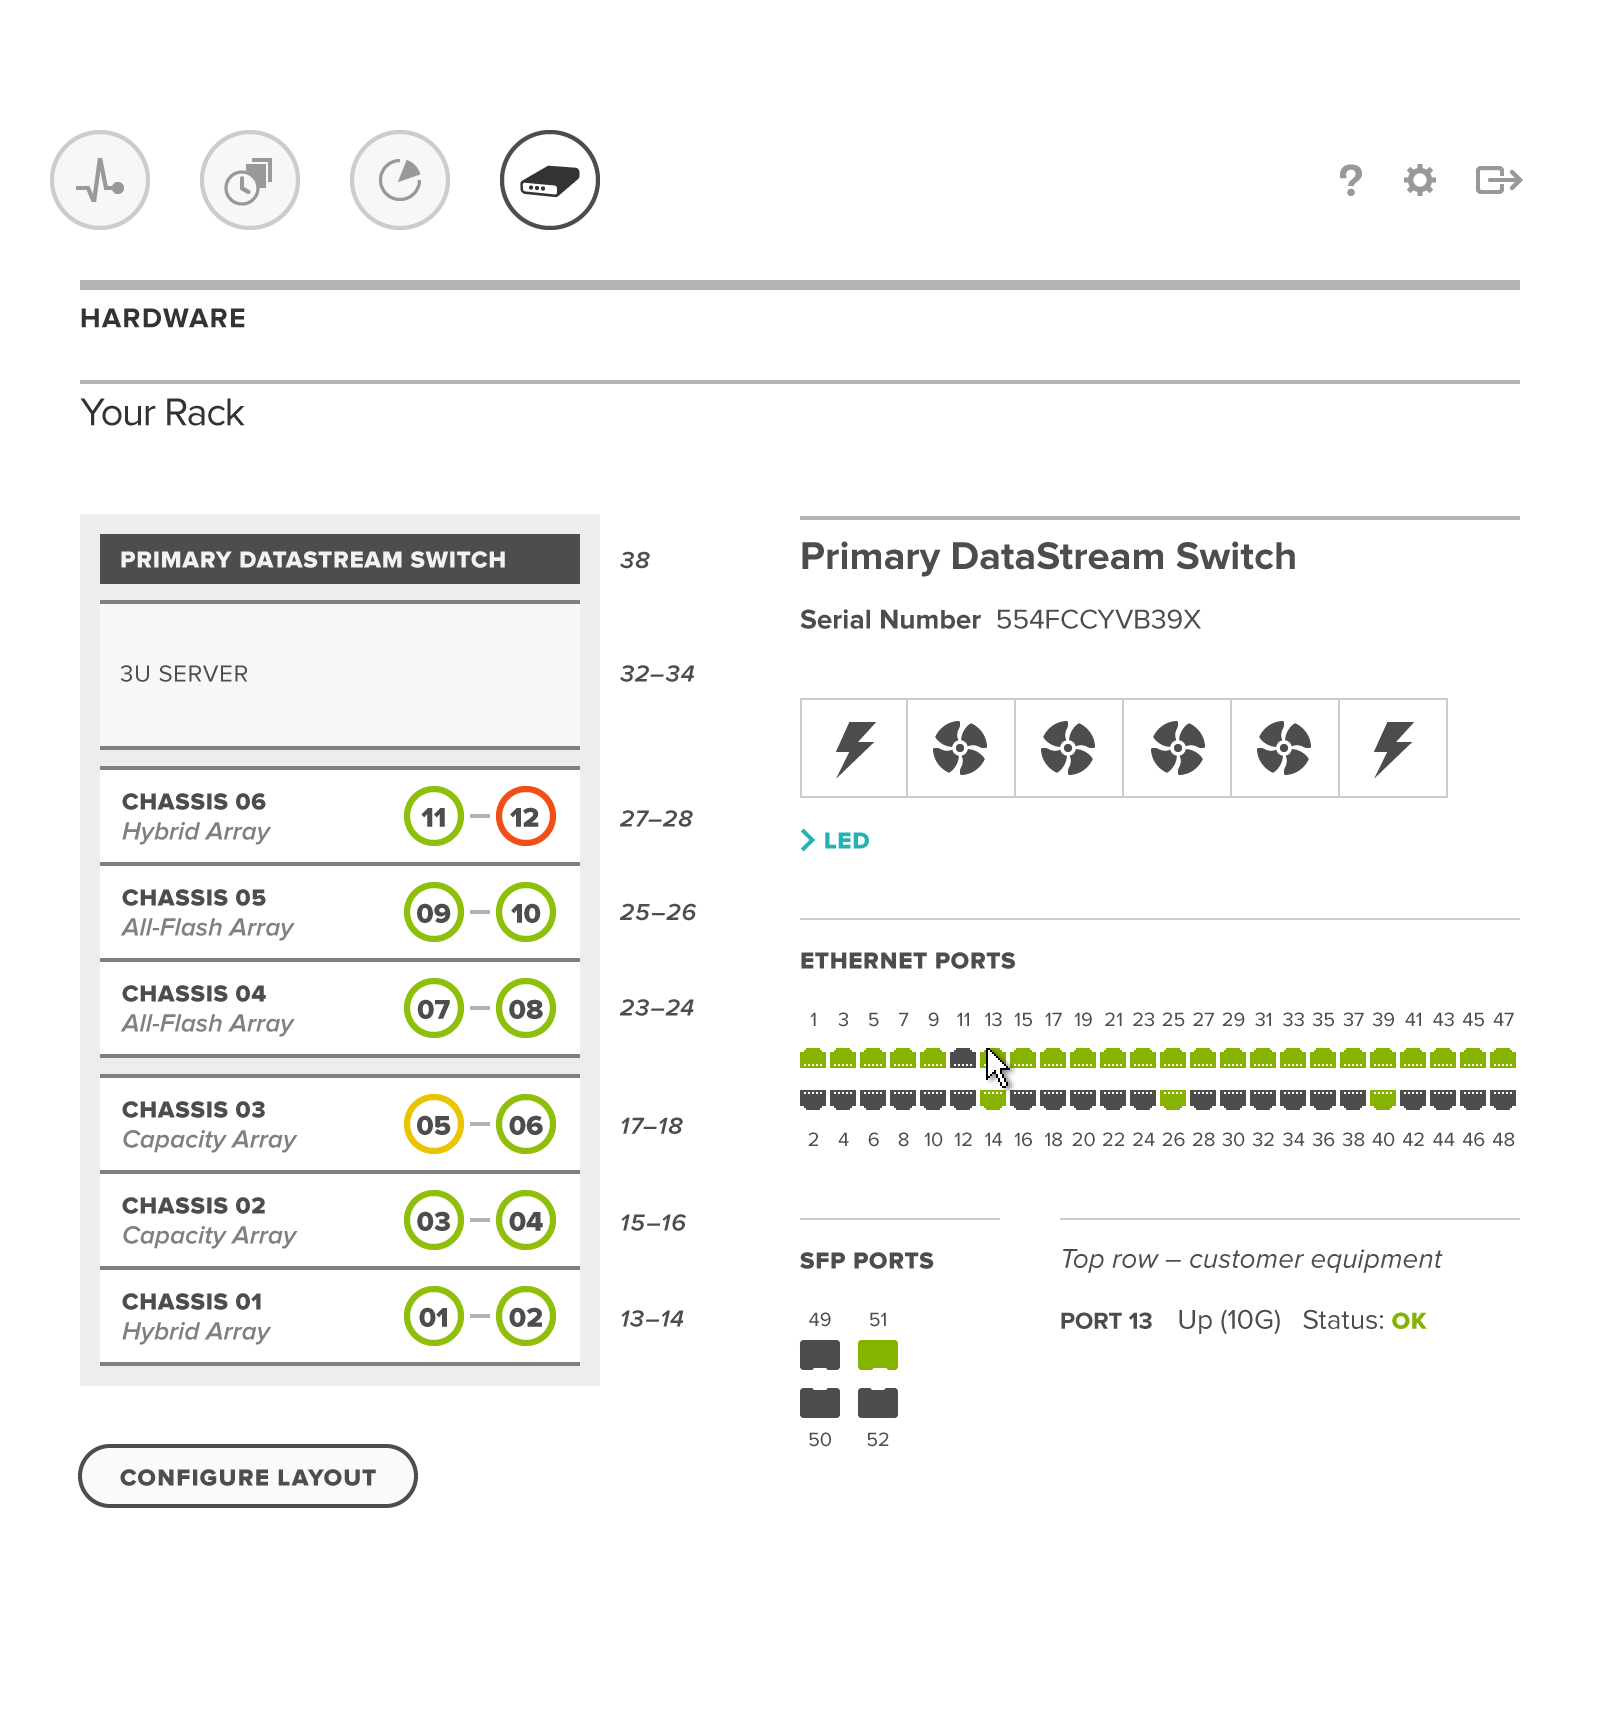
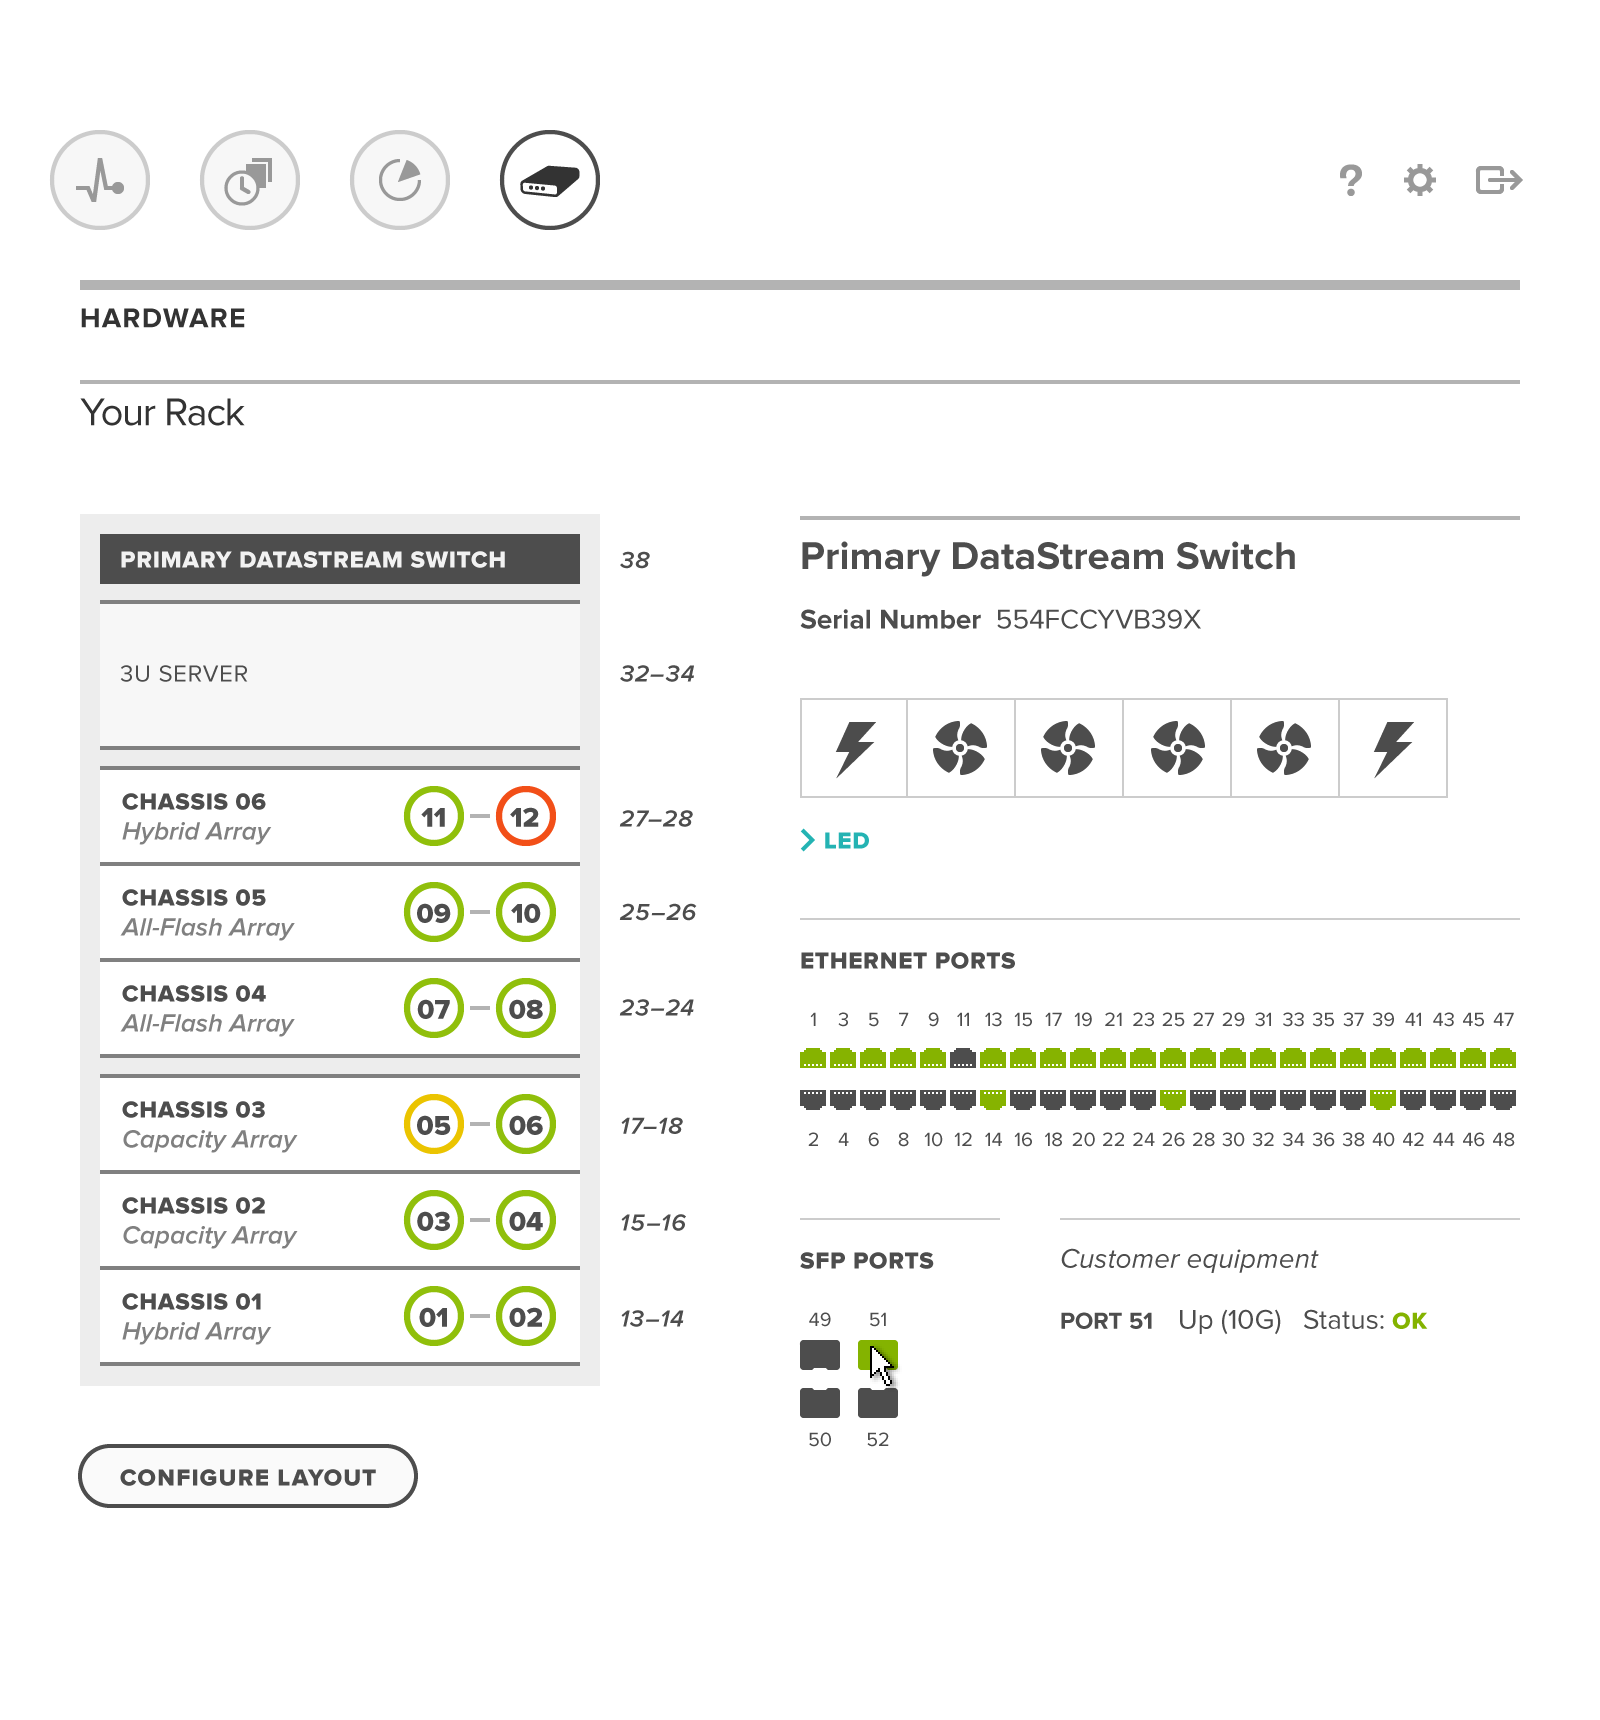
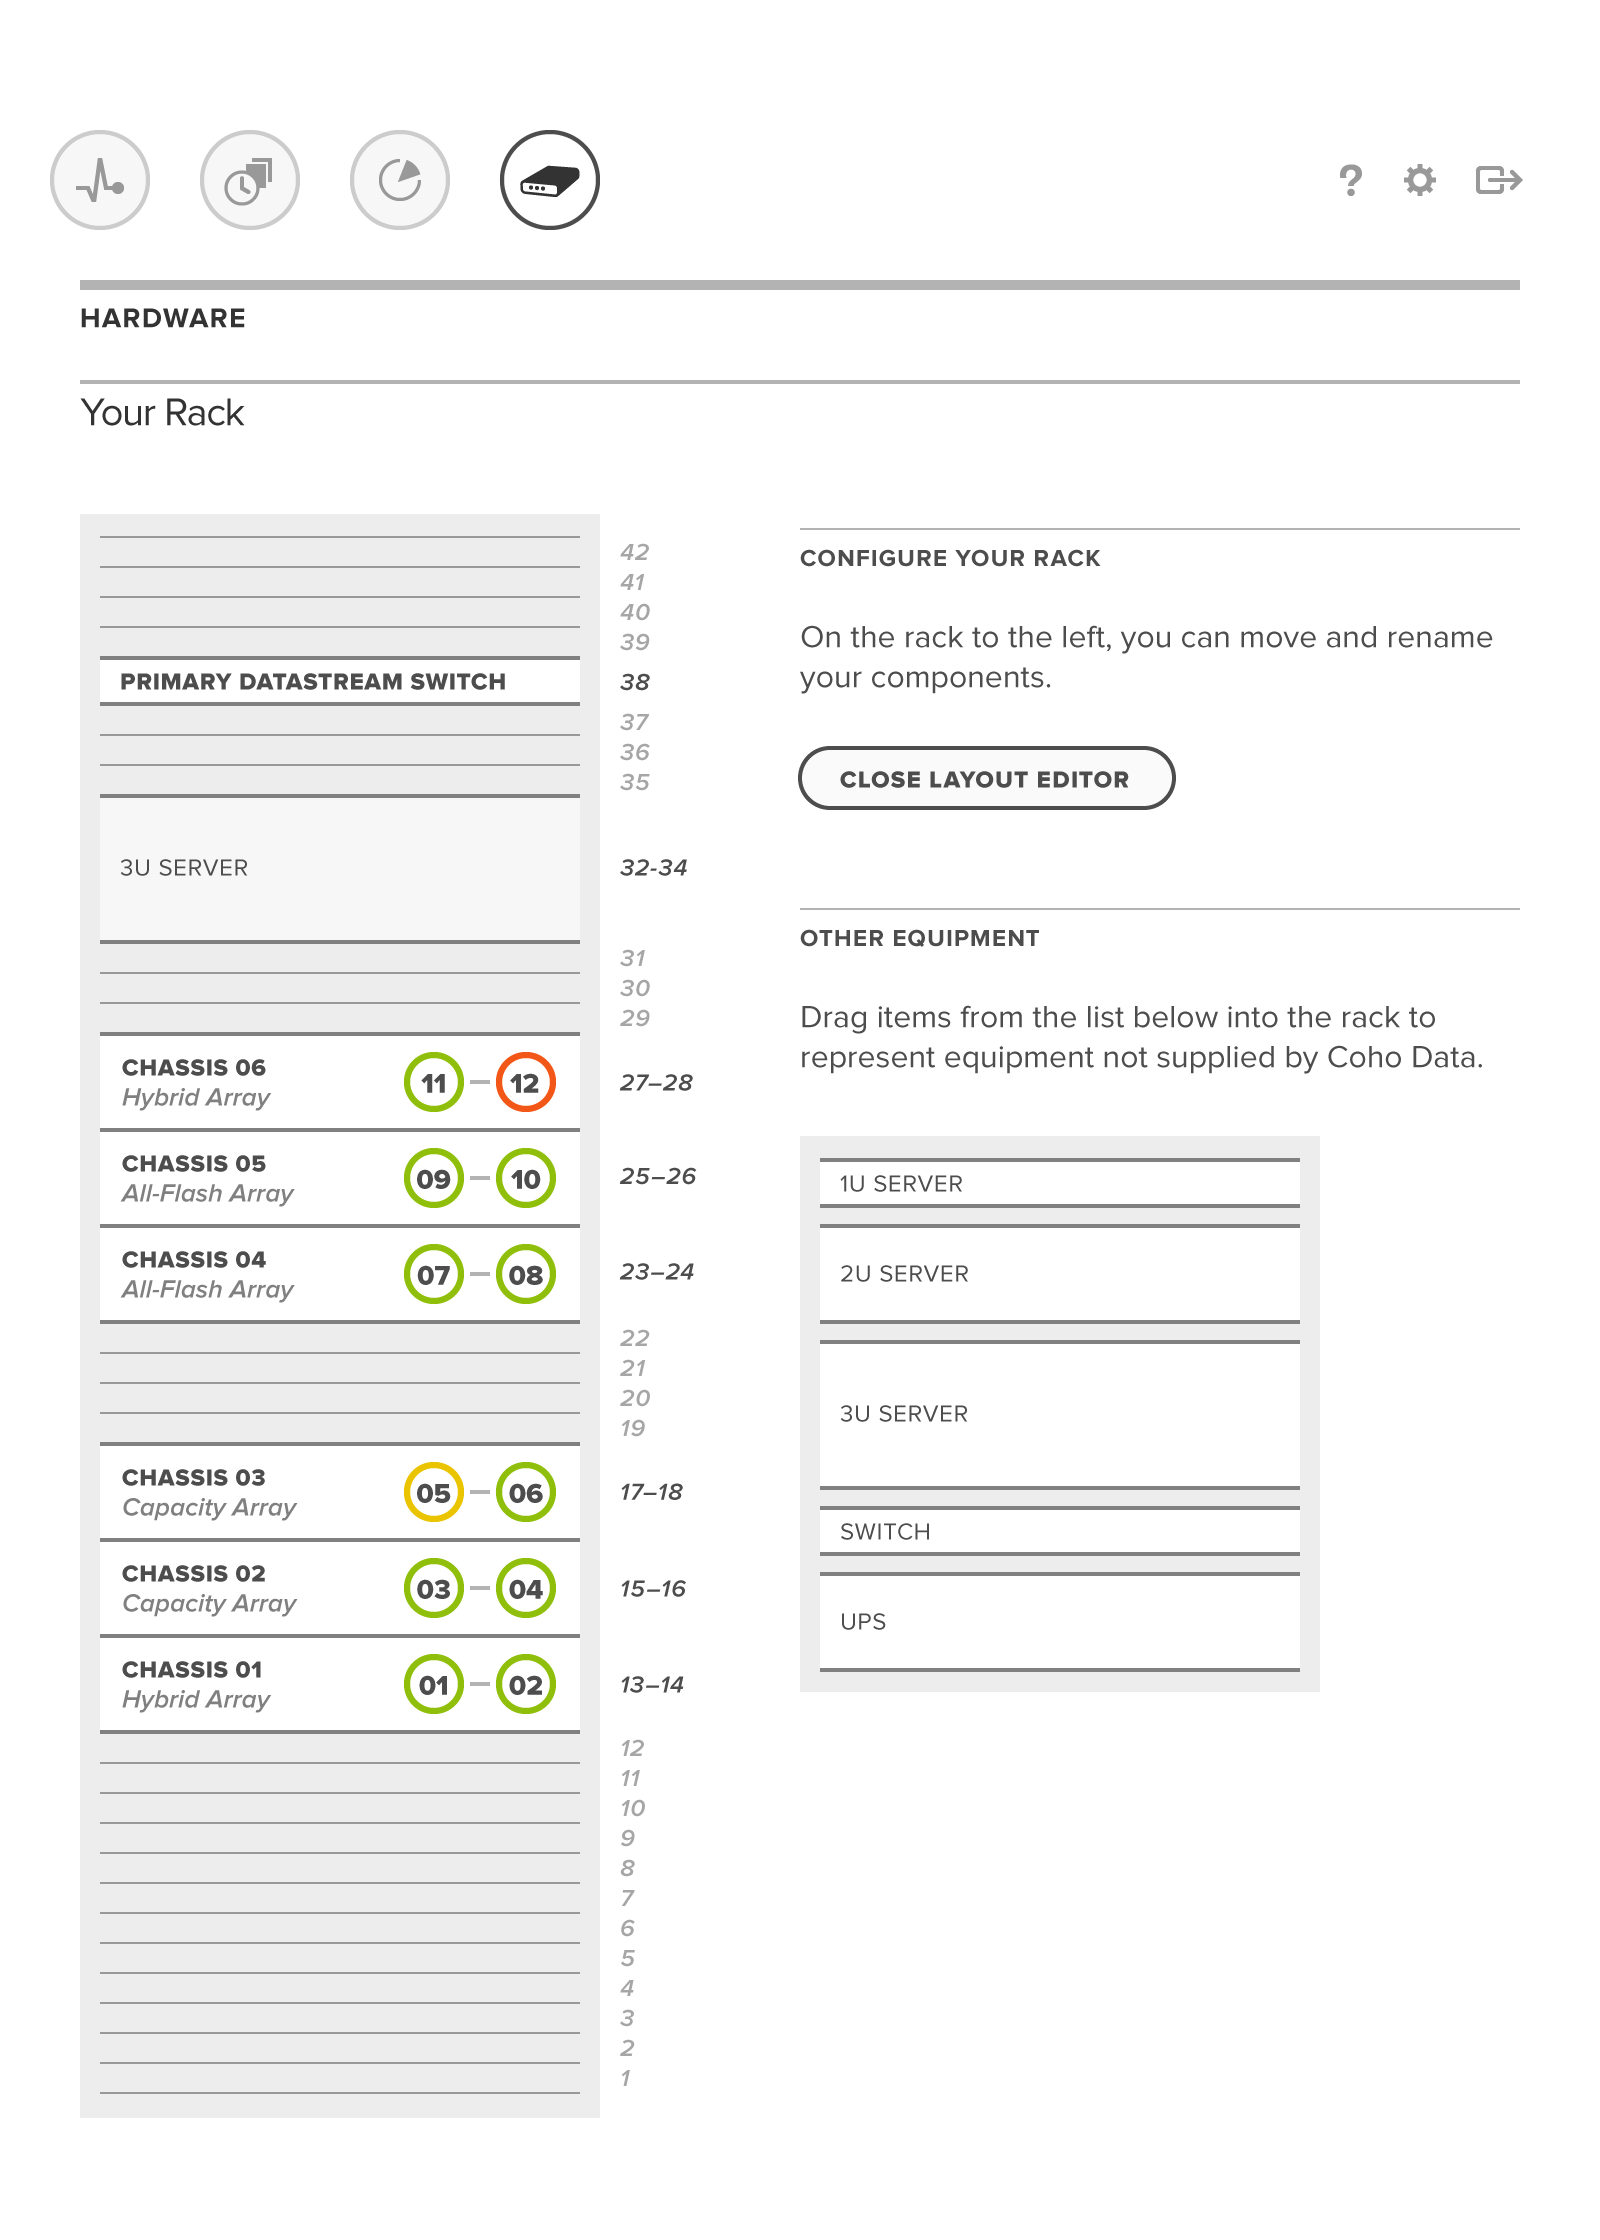
Hardware screen

Through a virtual mockup of their storage rack, Coho customers can quickly identify and locate failing, or struggling, real-world hardware.
Hardware screen gallery — select a thumbnail to view as a slideshow

Safety in numbers
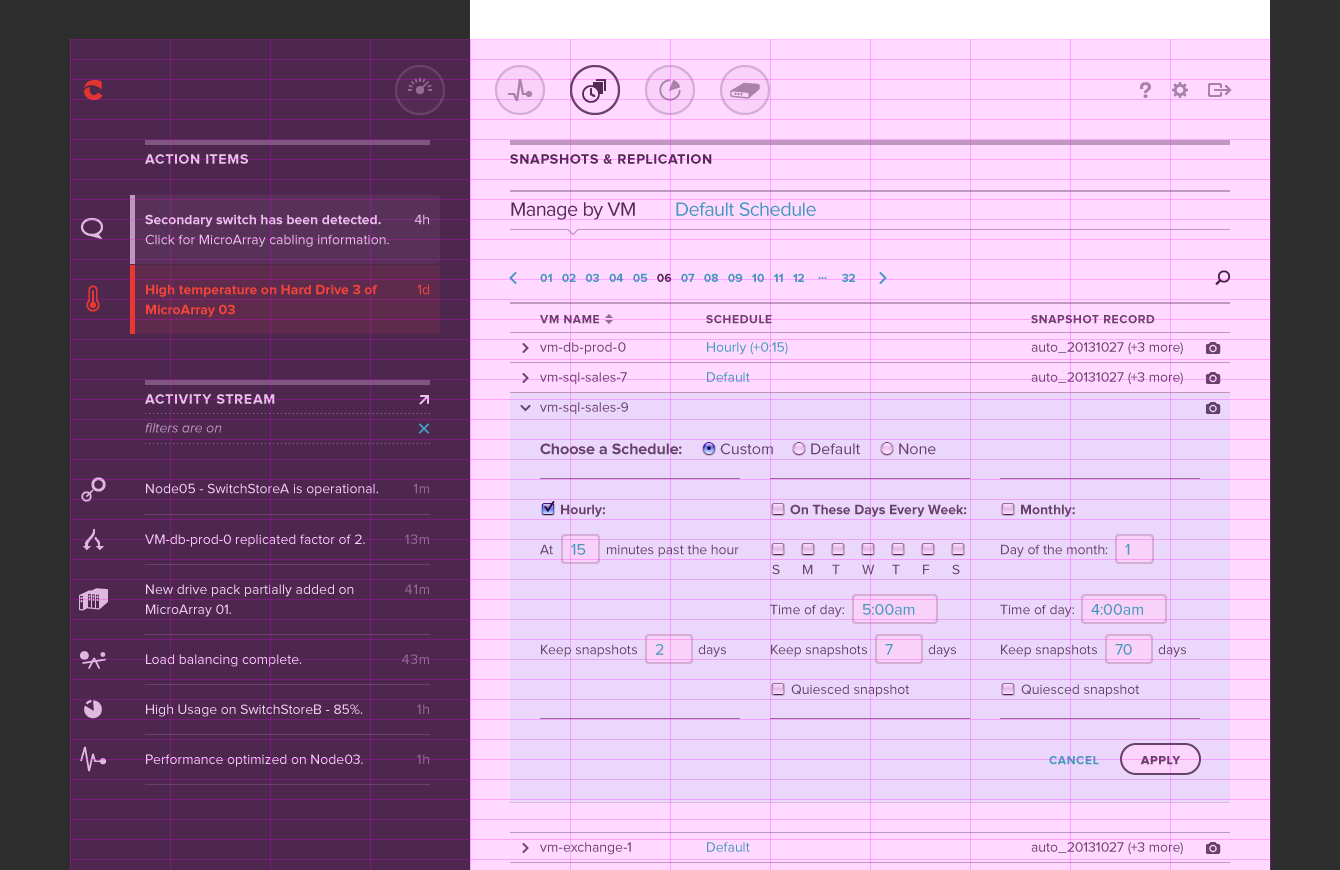
Snapshots + replication
The scheduling and management of virtual machine duplication (cloning), state capturing (snapshots) and backups (replication) required a multi-layered UI.
Various Snapshots + Replication screen layouts
Off the charts
Workoads screen
With the Workloads screen, customers can plot the performance of individual virtual machines (workloads) or their entire cluster, across several different metrics, to compare and hone in on poor performers.
What a setting
Configuration screens
The system configuration screens had very unique content one to the next, and required a third level of navigation to structure properly.
Baby one more time
Iconography
Over the course of the project, we iterated through hundreds of icons for various screens and the main navigation.
Some of the final and in-progress icons generated for the Coho Data software UI
We’ve got rhythm
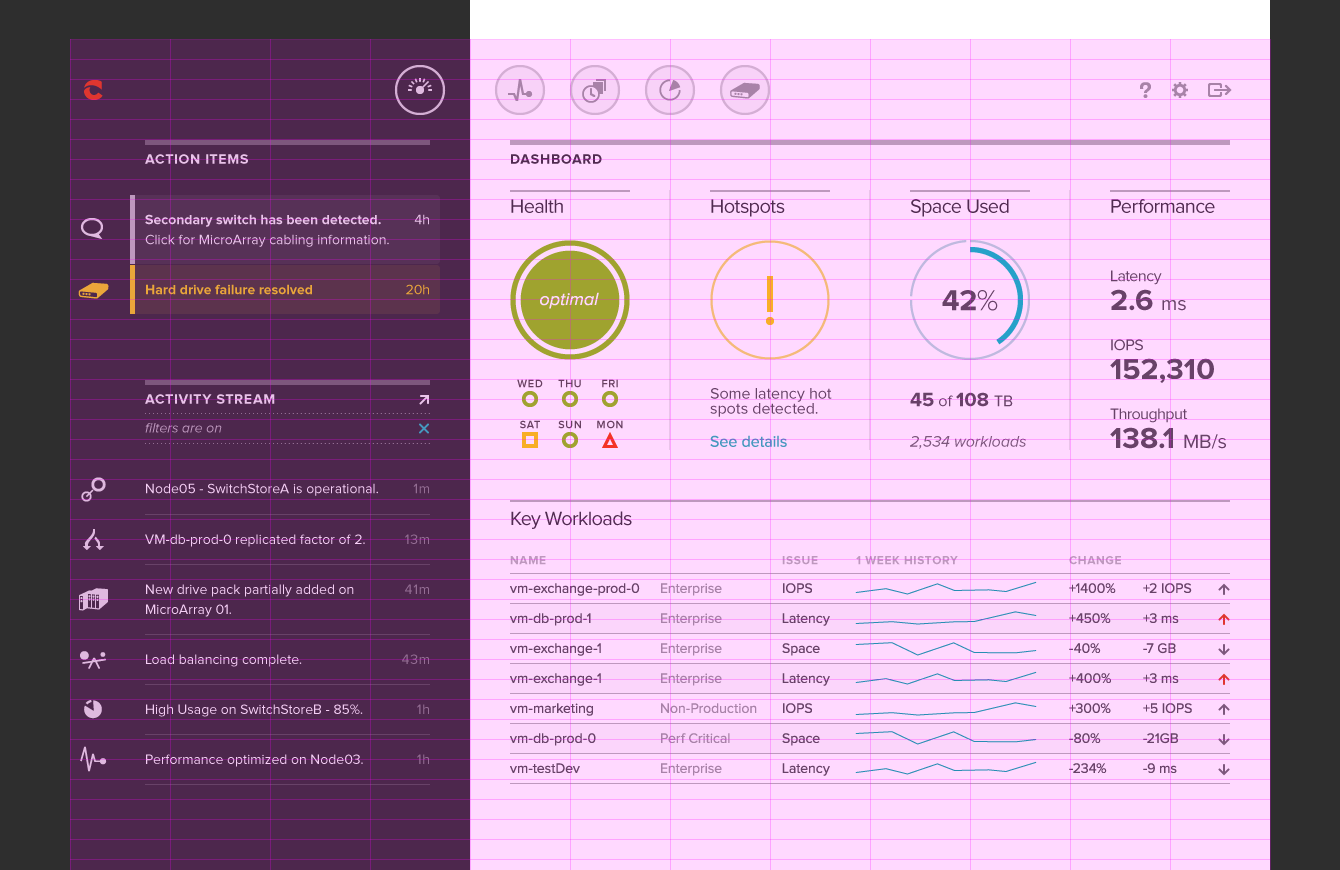
Grid structure
Structure and consistency were maintained from screen to screen with a 12-column grid and vertical rhythm. Seems basic, but in the world of data storage software, this was novel stuff ;)
Slideshow — grid overlays


We go way back
Early design iterations
Below is a collection of early Dashboard design explorations, as we worked through colour weighting, contrast, typography, scale, and more.